
Summary
Radionuclides found in leachates of WTC girders:
Tritium, barium, beryllium, cobalt, selenium, rubidium, strontium, yttrium, zirconium, niobium, molybdenum, cadmium, antimony, cesium, bismuth, thorium, uranium
Radionuclides found in WTC dust:
Barium, beryllium, cobalt, rubidium, strontium, yttrium, niobium, molybdenum, cadmium, antimony, cesium, cerium, bismuth, thorium, uranium
Radon was detected at Fresh Kills landfill
Debris and dust from the WTC was moved to Fresh Kills landfill

Many fluorescent objects contain tritium
WTC tritium concentration was 15x safe EPA level
In the study, the amount of dilution of tritium is evaluated and the estimated amount of tritium from expected sources of tritium is estimated. After making for adjustments for the dilution factor (see the report below the government study), the amount of tritium at the WTC is calculated to be 300 nCi/L. Safe EPA level for drinking water is 20 nCi/L.
Study: Quantity of tritium at the World Trade Center
The following is a study analyzing the quantity of tritium at the World Trade Center. Tritium is an isotope that is produced in nuclear reactions.
Study of Traces of Tritium at the World Trade CenterT.M. Semkow, R.S. Hafner, P.P Parekh, G.J. Wozniak, D.K. Haines, L. Husain, R.L. Rabun, P.G. Williams This article was submitted to 23rd American Chemical Society National Meeting, Orlando, FL, April 7-11, 2002 October 1, 2002 Approved Traces of tritiated water (HTO) were detected at the World Trade Center (WTC) ground zero after the 9/11/01 terrorist attack. A water sample from the WTC sewer, collected on 9/13/01, contained 0.164±0.074 (2σ) nCi/L of HTO. A split water sample, collected on 9/21/01 from the basement of WTC Building 6, contained 3.53±0.17 and 2.83±0.15 nCi/L, respectively. These results are well below the levels of concern to human exposure. Several water and vegetation samples were analyzed from sites outside ground zero, located in Manhattan, Brooklyn, Queens, and the Kensico and Croton Reservoirs. No HTO above the background was found in those samples. Tritium radioluminescent (RL) devices were investigated as possible sources of the traces of tritium at ground zero. It was determined that the two Boeing 767 aircraft that hit the Twin Towers contained a combined 34 Ci of tritium at the time of impact in their emergency exit signs. There is also evidence that many weapons from law enforcement were present and destroyed at WTC. Such weaponry contains by design tritium sights. The fate and removal of tritium from ground zero were investigated, taking into consideration tritium chemistry and water flow originating from the fire fighting, rain, as well as leaks from the Hudson River and broken mains. A box model was developed to describe the above scenario. The model is consistent with instantaneous oxidation of the airplane tritium in the jet-fuel explosion, deposition of a small fraction of HTO at ground zero, and water-flow controlled removal of HTO from the debris. The model also suggests that tritium from the weapons would be released and oxidized to HTO at a much slower rate in the lingering fires at ground zero. 1. World Trade Center The World Trade Center was built in New York City during the 1960s through the 1980s. It contained seven buildings designated as WTC 1 through WTC 7. The most prominent were the 110-floor Twin Towers, WTC 1 – The North Tower built in 1970, and WTC 2 – The South Tower built in 1972. The WTC was owned and operated by the Port Authority of New York and New Jersey (PANYNJ). It is important to this investigation that several federal law enforcement agencies were located at the WTC (1,2). US Customs and the Bureau of Alcohol Tobacco and Firearms (ATF) were housed in WTC 6, also called the US Customs House. US Secret Service, Central Intelligence Agency, and the New York City emergency command center had offices in WTC 7. The original, 1776 Manhattan shoreline crossed the WTC complex in the north-south direction. The present-day land to the west of the complex is actually a fill (3). Since WTC 1 and 2 had to have foundations down to the bedrock, the required engineering solution was achieved by constructing the so called Bathtub. It is surrounded by the Slurry Wall, 510 ft × 980 ft, 70-ft deep, and 3-ft thick (4). The Slurry Wall prevented leaks from the Hudson River. Besides the foundations of the buildings, the Bathtub contained a Concourse and a six-level basement underground. On the lowest B6 level there was a tunnel and a station for the Port Authority Trans-Hudson (PATH) train, providing commuting from and to New Jersey under the Hudson River. 2. The Terrorist Attack On September 11, 2001 at 8:46 AM, a Boeing 767-223ER aircraft operated by American Airlines as Flight 11 hit WTC Tower 1 causing jet fuel explosion and fire. At 9:02 AM, a second aircraft, a Boeing 767-222 operated by United Airlines as Flight 175, hit WTC Tower 2. Both flights originated in Boston, so the aircraft were full of fuel, estimated at 10,000 gallons each (5). WTC 2 collapsed after 47 min, followed by WTC 1 which lasted 102 min. The collapse of the Towers has been studied in detail (5,6,7). The floor trusses of the Towers were supported by the steel perimeter columns, while the central columns supported the elevator shafts. If there had been no fire, the Towers would have not collapsed. However, due to the fires, when temperature reached 1500F, the steel support systems lost their strength, causing the structures to collapse. By some estimates, the temperatures could have locally reached 1800C from burning of the aluminum bodies of the airplanes. At this temperature, hydrogen gas is evolved from burning of the concrete, which fuels further burning. The reasons that WTC 2 collapsed first included the higher speed of the aircraft at collision (586 mph) compared to the speed of the aircraft colliding with WTC 1 (494 mph), as well as noncentral and lower point of impact in the case of WTC 2. The collapsing Towers destroyed other WTC buildings, and the debris compacted and destroyed much of the Bathtub. The debris from WTC 1 plunged through the center of WTC 6, creating a pit stretching down to the basement of the Bathtub (8). At 5:30 PM, WTC 7 collapsed due to a weakening of its steel support structure caused by a diesel fuel fire. The fuel was stored in the tank for emergency power generation for the New York City emergency command center (9). The WTC area is referred to as ground zero. Authorities determined that 2823 people died in the attack on the WTC (5), including 157 people onboard the aircraft, 343 New York City Fire Department firefighters, 23 officers from the New York City Police Department, 37 officers from the PANYNJ Police Department, and 3 officers from the New York Office of Court Administration (10,11). 3. Tritium Measurements Tritium is produced naturally in the atmosphere from the reactions of cosmic ray protons and neutrons with N and O nuclei, as well as by ternary fission in geological formations (12,13,14). However, the bulk contribution to environmental accumulation comes from the nuclear testing in the atmosphere, nuclear fuel cycle, and some from consumer products. The total present-day inventory of tritium in the environment is 19 EBq, only 1.3 EBq of which is attributed to natural production (15). The levels of tritium in the environment have been decreasing steadily, due to its decay with a half-life of 12.3 years, since the ban on atmospheric nuclear testing. Tritium occurs in the environment primarily as tritiated water, and much less as organically bound tritium. Typical current concentrations of HTO in water in the US are 0.1-0.2 nCi/L (16). We became interested in the subject of tritium at WTC because of the possibility that tritium RL devices could have been present and destroyed at WTC. Three groups of environmental samples were analyzed for tritium as HTO, to confirm or disprove this hypothesis. The 1st group consisted of the samples collected by the EPA not specifically for tritium analysis. They were analyzed for tritium after this investigation had started. The 2nd group was analyzed for tritium before this investigation started, and was collected by the New York City Department of Environmental Protection (samples 23-35 at the request of EPA). The 3rd group consisted of the samples collected especially for this investigation. Water was distilled once from the environmental stationary water samples, and twice from the vegetation samples. 10 ml of such distillate was mixed with 13 ml of Instagel XF cocktail (Packard) in a borosilicate glass vial and measured on an ultralow-background liquid scintillation counter TRI-CARB, model 3170TR/SL by Packard. The samples from groups 1 and 3 were measured for 200 min, while from group 2 for 100 min. The tritium end-point beta energy is 18.6 keV. We used the energy window 1-13 keV to maximize signal to background ratio. The background rate was about 2 cpm. The efficiency of the instrument was calibrated using HTO standards as a function of the tSIE quench index. The environmental samples had a tSIE value around 230, corresponding to efficiency in the range 0.20-0.25. The results are given in Table I. Samples 1,6, and 7 are from ground zero and they are all positive. The rest of the results in Table I are upper limits. Sample 1, measuring 0.164±0.74 nCi/L, is from the WTC sewer, collected three days after the attack, and is just above the detection limit. Samples 6 and 7 of about 3 nCi/L are split samples from WTC 6, basement B5, collected 10 days after the attack. Thus, tritium was detected in these samples from ground zero, but the concentrations are very low. In fact, 3 nCi/L is about 7 times less than the EPA limit in drinking water of 20 nCi/L (17). No health implications are known or expected at such low concentrations (13). As a consequence, no additional ground-zero samples were judged to be necessary. Samples 2-5 are from roof tanks in South Manhattan near ground zero. Since these tanks are vented, there was a possibility of some atmospheric contamination, although
http://www.llnl.gov/tid/lof/documents/pdf/241096.pdf Caption: Tritium table restricted. Samples 23-35 are from the New York City water distribution system in South Manhattan, which is closed to the atmospheric deposition. All of these samples do not show any tritium present, as expected. There was also a possibility that some HTO would have been transported with the fire plume during the first several days after the attack and deposited downwind. The wind direction was approximately northwest during 9/11 and 9/12 (18). Therefore, we did environmental sampling in Brooklyn, Queens, and South Manhattan, which are downwind from ground zero. The sample numbers are 37-48 and 51 in Table I. They were taken about seven weeks after the attack. All the results were zero within the detection limits, which is consistent with the low levels of HTO detected at ground zero. 4. Tritium Radioluminescent Devices The difference between tritium RL devices and CRT tubes is that, in the former, β particles from tritium decay, rather than accelerated electrons, generate light in the phosphor (14). ZnS is the most widely used phosphor and is activated by an impurity. ZnS-Ag gives a green glow, with a decay constant of 0.2 μs. ZnS-Cu gives blue-green light, and ZnS-(Cu,Mg) gives yellow-orange light (19). There are two basic types of RL devices: i) gaseous tritium light sources (GTLS) sealed in borosilicate glass tubes, internally coated with the phosphor, and ii) tritium chemically incorporated into a polymer such as polystyrene and mixed with the phosphor. There is no tritium leakage from GTLS, unless broken. There is a small diffusion of tritium from polymers. GTLS are used as airport runway lights at remote airports (Alaska); emergency EXIT and other signs in buildings; emergency EXIT signs, handles, and aisle markers in airplanes; as well as sights in weaponry and markings in time devices. The polymer-based RLs are used in emergency signs and as paints in watches. When GTLS tubes age, they acquire a small percentage (<2%) of HTO due to radiolytic reactions with the phosphor binder (14,20,21). Typical emergency EXIT signs in buildings contain from several to several tens of Ci of molecular tritium. The maximum recommended tritium activity by ANSI standard is 50 Ci (22). The activity of tritium is regulated by the Nuclear Regulatory Commission (NRC), per request of a manufacturer. For instance, Mb-microtec ag registered with NRC sealed RL devices for up to 50 Ci (19). The typical content of tritium per device is 10 Ci. The tritium emergency signs in airplanes have a regulatory limit of 10 Ci (23). GTLS are used extensively in weaponry and are standard equipment in military as well as law enforcement. Of interest to this work are gun sights containing GTLS capsules, either cylindrical or spherical, which facilitate aiming at night. There are two categories of interest: scopes and night sights. The content of tritium depends on the configuration as well as on the manufacturer. Trijicon Inc. uses 100 mCi in scopes and three capsules of 18 mCi each (54 mCi total) in night sights (24). Innovative Weaponry Inc. uses 54 mCi in their PT night sights (25). Meprolight Ltd. uses between 30 to 54 mCi per set of night sights (26). Tritium in timing devices is used as GTLS or polymer paint. NRC regulations limit tritium content per timepiece to 25 mCi for paint (27) and 200 mCi for GTLS (28). The ISO standard recommends for paints a maximum average activity of 5 mCi per lot, and 7.5 mCi per isolated instrument (29). The US military standard recommends the maximum activity for a GTLS device as 25 mCi (30). A major manufacturer of GTLS-containing watches is Mbmicrotec ag, who offers the watches to the US market under the brand name Luminox. The watches are licensed with NRC under NR-0446-D-103-E for up to 100 mCi of tritium; however, the watches on the market contain up to 41 mCi of tritium (31). Luminox makes dive watches for the US Navy and aviator watches for the US Air Force. Consumer models are available. These types of watches are expensive, available through specialty stores only and are, therefore, not widely worn. Less expensive and more popular watches use paint containing tritiated polymer, in a plastic casing. A major manufacturer of tritiated paint is Rc Tritec ag. The typical range of tritium activity per timepiece is 0.8-2.7 mCi (32). However, a non-radioactive photoluminescent material, Super-LumiNova, has been developed by Nemoto & Co., based on mixed aluminum oxides and activated with a rare earth element (19). It is characterized by high intensity and long afterglow, and is used in more than 95% of luminescent watches currently manufactured, instead of tritium paint (32). 5. Sources and Fate of Tritium at WTC As described in Section 3, HTO was detected at ground zero at the very low concentrations. Several sources of tritium were considered and analyzed, as consistent with the experimental data: i) EXIT signs in the buildings, ii) emergency signs on the airplanes, iii) fire and emergency equipment, iv) weaponry, and v) timepieces. Presence of RL EXIT signs in the buildings would have implied large available source of tritium. We were informed by PANYNJ authorities that there were no tritium signs at the WTC, only photoluminescent ones (33). This is entirely consistent with our observations. It was determined by the Federal Aviation Administration that Boeing 767, Serial Number 21873, operated by United Airlines, Tail Number 767-222 N612UA, was delivered in February, 1983, with 43.2 Ci of tritium in emergency signs (34). The 43.2 Ci of tritium was contained in four EXIT signs (10 Ci each) and four slide/raft handles (0.8 Ci each). The same activity of tritium was present upon the April, 1987 delivery of the second Boeing 767, Serial Number 22322, Tail Number 767-223ER N334AA, operated by American Airlines. Since neither of these aircraft were modified after delivery (34,35), the total activity from the aircraft was 34 Ci at the time of attack, when the radioactive decay of tritium has been accounted for. The tritium from the airplanes was released at the two points of impact with the Towers. Conversion of molecular tritium (T2) to HTO in the atmosphere is normally negligible: the formation of HTO through chemical kinetics is extremely slow (36). Rather, the conversion to HTO in atmospheric transport goes through a stage of deposition of molecular tritium to soil, followed by a microbial and exchange oxidation in soil. HTO is then directly reemitted, or taken up by plants first and then reemitted into the atmosphere. The combined process results in measured conversion rates of between 10−5 and 10−3 for downwind distances of up to 15 km. However, at each of the two points of impact there was an explosive release. Considering the jet fuel explosion and high-temperature fires at the WTC, T2 was efficiently oxidized to HTO, based on weapons-testing data (37), as well as laser heating experiments (38). This oxide immediately vaporized due to the intense heat. Most of the HTO would be transported in the vapor phase with the wind, since the weather was dry on 9/11/01 (18). One cannot accurately determine how much HTO condensed on building surfaces and deposited on the ground with the collapse of the buildings, but this would have been a small fraction of the 34 Ci available. One indication is the low 0.164±0.74 nCi/L from the WTC sewer, collected two days after the attack. Since the initial source was small, it is consistent that the environmental samples collected downwind over seven weeks after the attack contained no tritium (Section 3). It is important to compare this small release of tritium in the fire with two other incidents caused by fire and involving the release of molecular tritium. One incident involved a fire in a community building at Council, Alaska, on 9/6/87, where 12 RL light panels for airport runway marking were stored, totaling 3000 Ci of tritium (39). It was a free-burning fire, which consumed the building in 1 hr. Tritium assessment was done 11 days after the accident. The remaining GTLS tubes were mostly undamaged but disfigured, indicating that all tritium had escaped. No air-borne tritium was detected. All tubes were carefully wiped on surfaces, and the HTO activity from the wipes amounted to 6.5×10⁻⁸ of that originally present. No HTO was found in bioassay or environmental samples. The release scenario at the WTC from the airplanes is consistent with this accident. However, the Twin Towers collapsed before their complete burning, so the fraction of tritium deposited at the WTC might be larger. Another incident, involving containers with tens of thousands Ci of tritium, was a fire on a C-124 airplane on the ground at the Wright-Patterson Air Force Base, Dayton, OH, on 10/12/65 (40). That fire was actively extinguished. Elevated levels of HTO were found in bioassay samples, on emergency and fire equipment, clothing, in the debris, as well as in the soil and water from nearby samples. In comparison with the Alaska incident, the active fire fighting contributed to capture of some of the HTO on site. After the WTC buildings collapsed, fire fighting and rescue operations continued. The fires at ground zero were smoldering for months after the attack (41). It was determined that 3 million gallons of water were hosed on site in the fire-fighting efforts between 9/11 and 9/21 (the day of the tritium measurement; samples 6 and 7 in Table I) (42). In addition, there were two episodes of rain during the same 10-day period: on 9/14 and 9/20,21 (18), totaling 0.9 million gallons of water in the Bathtub area. Considering the neighboring areas, we take 1 million gallons from the rain. Therefore, a total of 4 million gallons of water percolated through the debris in the first 10 days and collected at the bottom of the Bathtub. The percolating water efficiently dissolved that part of the airplane HTO, which was deposited in the building collapse, and carried it to the bottom of the Bathtub. An engineering assessment determined that there was a water leak into the Bathtub, adding to the rain and hose water. The main leak was from the Hudson River via two WTC cooling water outfall lines, while the incoming lines were shut down (43). There were reported leaks from broken water mains (3,44). There were also problems with the water table due to a hole in the damaged Slurry Wall along Liberty Street (45). The combined water from rain and hoses, as well as the leaks, collecting at the bottom of the Bathtub, transferred into the PATH train tunnel. Water then flowed under the Hudson River to the Exchange Place Station, Jersey City, NJ, since it is lower in elevation than WTC B6 level (3,43), where it was pumped out. Other pumps were installed (after 9/21) along Liberty Street to stabilize the Slurry Wall, which had moved (45). Based on the pumping records, a total of 30 million gallons of water passed through the Bathtub between 9/11 and 9/21 (4,46). Therefore, 26 million gallons were from the leaks. Even on 10/8/01 there was still some water flowing to New Jersey (44). HTO that collected at the bottom of the Bathtub was removed with the water flow. The 9/21 HTO sample, reportedly collected from basement B5, sampled that dynamic system close to the bottom of the Bathtub. It was concluded that fire and emergency equipment could not have been a source of tritium, since such equipment does not typically use tritium RL devices, at least for the type of emergency response conducted at the WTC. Weaponry was another likely source of tritium. As described in Section 1, several federal and state law enforcement agencies were housed at WTC, in buildings 6 and 7. ATF had two vaults filled with tactical weapons and guns (1,47,48). The ATF vaults were in WTC 6, where our samples 6 and 7 were measured. A total of 63 police officers died in the attack (11). They may have been carrying pistols equipped with tritium night sights. In fact, many guns have been recovered from the debris (47,48,49), some of them in good condition. It would take 20 equipped weapons destroyed, 50 mCi each, to give approximately 1 Ci of tritium (Section 4). Considering that there were 2823 victims in the attack, tritium watches could have been another source of tritium. Tritium paint watches were less likely, since they contain much less tritium and are generally no longer manufactured in modern watches (Section 4). However, GTLS-type watches, although expensive, could have been worn by more affluent public of Lower Manhattan. In addition, the military-style watches may have been worn by the emergency/law enforcement personnel who perished. It would take 40 GTLS watches, 25 mCi each, to give 1 Ci of tritium activity. The GTLS watches can be obtained in specialty stores only. No specialty watch stores were located at WTC (50). Some watches, but not necessarily tritium, were recovered from the debris with only minor damage (49). Probability-wise, weapons were definitely present at WTC, and the law-enforcement types contain tritium night sights by design; tritium watches were probably present, but in numbers difficult to determine. The mechanism of tritium release from either the weapons or watches would have been much different than from the airplanes. Some devices could have been catastrophically destroyed in the buildings collapse; however, surprisingly, many were recovered with only minor damage. In addition, GTLS weapon sights are well-encapsulated in metal protective shields. Many devices would have been subjected to smoldering fires of much lower temperature than the explosive and high-temperature fires up in the Towers (with the exception possibly of the WTC 7 fire). At such temperatures, GTLS tubes would soften and disfigure, slowly releasing tritium. Some of that tritium would diffuse from the debris and be dispersed in the air, while some would remain trapped in the debris. While oxidation of molecular tritium is slow in the air, tritium is known to adsorb on surfaces and exchange with the adsorbed monolayer of water to form HTO due to a catalytic action of the surface (14,51,52,53). At elevated tritium concentrations, radiolytic and hot-atom chemistry effects also assist in the oxidation (21). Consequently, some molecular tritium released in the debris would convert to HTO and be swept with the hose and rain water down to the basement of the Bathtub, sharing the fate of HTO from the airplanes, but on a much slower time scale. This mechanism resembles leaching of HTO from landfills containing tritium RL devices (54). 6. Modeling of Water Flow and Tritium Removal from Ground Zero A 3-Box model was developed to quantify water flow and tritium removal, depicted in Fig. 1. Box 0 describes the debris, from which HTO is assumed to be transferred to the flowing water at a rate λ. The Bathtub is divided into 2 boxes.
http://www.llnl.gov/tid/lof/documents/pdf/241096.pdf Box 1 consists of 6/7 of the void volume of the Bathtub, through which 1.51×10^7 L of the hose and rain water flowed in 10 days. Therefore, an experimental flow rate f1=1.51×10^6 L/day through Box 1. Considering that the Bathtub was at least 50% destroyed and filled with the debris from the buildings (55), its air porosity could be assumed as 0.26 (a value for close packed spheres). For such porosity, the void volume can be calculated as V1=2.21×10^8 L. It would take V1/f1=146 days for such a volume to propagate through Box 1. The experimental volume of water would not have even reached the bottom of the Bathtub in 10 days. We conclude that the water could not have filled the air porosity completely and what really mattered was the water, rather than the air porosity. Water would flow through filled small pores, however, it would flow only on the surfaces of larger voids. A reasonable estimate of the water-filled void volume can be made by equating it to the experimental volume of water that is known to have flowed in 10 days, V1=1.51×10^7 L. This yields a water flow time constant s1=f1/V1=0.1/day for Box 1. The B6 level with the PATH tunnel is taken as Box 2. One could estimate an upper limit for the water porosity as 0.1. Its exact value is less important for the model, since the experimental water flow rate through Box 2, f2=1.14×10^7 L/day >> f1. This yields V2 = 1.42×10^7 L, and the water flow time constant s2=f2/V2= 0.803/day for Box 2. The following differential equations describe tritium propagation through the three boxes at ground zero, for a general tritium source: […] 7. Conclusions 34 Ci of tritium were released from the emergency tritium RL signs onboard the two Boeing 767s, on impact with the Twin Towers at the WTC. The measurements and modeling are consistent with a prompt creation of HTO in the jet-fuel explosion and fire, deposition of a small fraction of HTO at ground zero, and water-flow controlled removal from the site. The modeling implies that the contribution from the aircraft alone would yield the HTO deposition fraction of 2.5%. This value is too high by a comparison with other incidents involving fire and tritium. Therefore, the source term from the airplanes alone is too small to explain the measured concentrations, and another missing source is needed. There is evidence that weapons belonging to federal and law-enforcement agencies were present and destroyed at the WTC. Such weapons contain tritium sights by design. The exact activity of tritium from the weapons was not determined. The data and modeling are consistent with the tritium source from the weapon sights (plus possibly tritium watches) in the debris, from which tritium was slowly released in the lingering fires, followed by an oxidation and removal with the water flow. Our modeling suggests that such a scenario would require a minimum of 120 equipped weapons destroyed and a quantitative capturing of tritium, which is too high, since many weapons were found with only minor damage and tritium sights are shielded in a metal. Therefore, such a mechanism alone is not sufficient to account for the measured HTO concentrations. This indicates that the weapons/watches are consistent with the missing source, which would have complemented the airplane source. http://www.llnl.gov/tid/lof/documents/pdf/241096.pdf (Study of Traces of Tritium at the World Trade Center – T.M. Semkow, R.S. Hafner, P.P Parekh, G.J. Wozniak, D.K. Haines, L. Husain, R.L. Rabun, P.G. Williams) |


Comment on the study
If the tritium that was washed away is not included in the calculations, the results of the calculations would be very different. The researchers assume that all the tritium was in the Bathtub and PATH tunnels and had not been washed away. Furthermore, there is the possibility of uneven distribution of tritium.
The authors conclude that the tritium that was calculated to be present at the WTC site cannot be accounted for just by the Exit signs in the planes and that there must have been other sources. They provide an estimate of the number of weapons such as guns and watches that could have acted as possible sources of tritium.

IMAGE Caption: Watch with tritium-illuminated face (URL)

IMG: http://upload.wikimedia.org/wikipedia/en/thumb/c/c4/GTLS.JPG/800px-GTLS.JPG URL: http://en.wikipedia.org/wiki/Tritium Caption: Radioluminescent 1.8 curies (67 GBq) 6 by 0.2 inches (150 × 5.1 mm) tritium vials are simply tritium gas-filled, thin glass vials whose inner surfaces are coated with a phosphor. The “gaseous tritium light source” vial shown here is brand new.

IMG: http://upload.wikimedia.org/wikipedia/commons/b/b3/Nightsight.JPG URL: http://en.wikipedia.org/wiki/Iron_sight Caption: Self-luminous tritium-illuminated night sights of a SIG SG 550 assault rifle.

IMG: http://www.acmefire.com/_Library/images/exit_sign.jpg URL: http://www.acmefire.com/exit_signs.html
Tritium concentration at the WTC – 15x higher than safe level
Links to the study:
http://www.osti.gov/bridge/product.biblio….sti_id=15002340
https://pubarchive.lbl.gov/islandora/object/ir%3A119698/datastream/PDF/view
www.llnl.gov/tid/lof/documents/pdf/241096.pdf
https://e-reports-ext.llnl.gov/pdf/241096.pdf
https://www.osti.gov/biblio/15002340-study-traces-tritium-world-trade-center
Download pdf: tritium at world trade center
“MMC” discusses the quantity of tritium found at the site in the post called “WTC – Evidence of a nuclear explosion?” at physorg.com (see the chapter A Physicist Explains)
The following quote is from: http://forum.physorg.com/index.php?showtopic=4418&st=15 The link is no longer active.
“WTC – Evidence of a nuclear explosion?”QUOTE: “The government scientists who studied tritium at the WTC believe that tritium from 8 EXIT signs from the two planes, and tritium from a minimum of 115 weapons that were kept in the towers as well as tritium from a certain type of (expensive) wrist watch supplied the amount of tritium calculated from the samples taken at the WTC to have been released.
and
The fact is most of those source would be close to, if not older than the 12.4 year half-life. Tritium loses about 5% of it mass every year. The concentration is too high, you are asking me to believe that every source of tritium gathered in the same place and that the basement, sealed from the building, saturated in water which would dilute the concentration, managed to gather 5 times the amount, over a week later. No, that would indicate that more leached downwards over time, indicating that the source of the tritium was midway up the building…” |
He notes that on the 21 September the concentration of tritium increased:
QUOTE:
|
It was determined that [the]Boeing 767-222 aircraft operated by the United Airlines that hit WTC Tower 2 as well as [the] Boeing 767-223ER operated by the American Airlines, that hit WTC Tower 1, had a combined 34{.3} Ci of tritium at the time of impact, contained in emergency signs.
The tritium was diluted by 200,000+ gallons of water, from each tower, not to mention the amount of water afterwards and the uneven distribution of such material would make samples vary widely.
and
A sample is around 10ml, that means the concentration over the entire site would have been thousands times more. That would place the origional amount somewhere in the region of around…wait for it… Several environmental measurements were made to confirm or disprove this hypothesis. Water was distilled once from the environmental stationary water samples, and twice from the vegetation samples. 10 ml of such distillate was mixed with 13 ml of Instagel XF cocktail (Packard) in a borosilicate glass vial and measured on an ultralow-background liquid scintillation counter TRI-CARB, model 3170TR/SL by Packard. 200,000 gallons = 757,082,400 ml Divide that amount into 10ml… If 10ml samples were used, the origonal amount of tritium was in the order of: That’s per tower, so we must double those figures. The next major factor is that only a fraction of oxidized tritium would be converted to HTO, the rest would excape as a gas…tritium has the same properties as hydrogen. Next up, is the physical area that is covered and the absorbtion by surrounding materials and the flow of water away from the site…we are only left with residue. The authors of the report noted this and came to this conclusion:
I agree, however, I have additional considerations: If we now add the additional water sources noted by the report and run the calculation:
4,000,000 Gallons = 15,141,648,000ml /10 = 1,514,164,800 samples If 10ml samples were used: Now from here we can see that the first sample would provide a value of 5.35Ci/L of HTO… The plane had “34{.3} Ci of tritium at the time of impact”…the fist result ALONE would have accounted for 1/6 of the ENTIRE plane’s content of tritium. When you add this fact on top:
Taking into consideration 2 Twin Towers, 110 floors each, and assuming 5 EXIT signs per floor, 10 Ci of 3H each, would result in a total of 1.1×10^4Ci Then you can see we have a scenario were vast amounts of tritium would have been present. Therefore, the simple answer is this, yes, it is plausible that after 2 days (9/13/01) and 8 days later (9/21/01) the majority of the HTO was: pumped out, and that the residual amounts left represented around 1% of the total volume. It must be remembered that the evaluation was on health grounds only and further tests were not made:
This is very quick, so please excuse any minor errors, the bulk of this is correct. |
END QUOTE
_____________________________
Some facts about tritium
Normal total tritium use is less than one pound per year
|
One report estimated that the entire world-wide commercial use of tritium amounts to less than one pound per year. That includes not only night sights but watch dials, compasses, and emergency exit signs … all of which commonly rely on GTLS (gaseous tritium light sources). |
Tritium – From Wikipedia
|
Tritium (pronounced /ˈtrɪtiəm/ or /ˈtrɪʃiəm/, symbol T or 3H, also known as hydrogen-3) is a radioactive isotope of hydrogen. The nucleus of tritium (sometimes called a triton) contains one proton and two neutrons, whereas the nucleus of protium (by far the most abundant hydrogen isotope) contains one proton and no neutrons. Naturally occurring tritium is extremely rare on Earth, where trace amounts are formed by the interaction of the atmosphere with cosmic rays. The name of this isotope is formed from the Greek word “tritos” meaning “third”. [..] Nuclear weapons Tritium is widely used in multi-stage hydrogen bombs for boosting the fission primary explosion of a thermonuclear weapon (It can be similarly used for fission bombs.) as well as in external neutron initiators. Neutron initiator Actuated by an ultrafast switch like a krytron, a small particle accelerator accelerates ions of tritium and deuterium to energies above the 15 kilo-electron-volts or so needed for deuterium-tritium fusion and directs them into a metal target where the tritium and deuterium are adsorbed as hydrides. High-energy fusion neutrons from the resulting fusion radiate in all directions. Some of these strike plutonium or uranium nuclei in the primary’s pit, initiating nuclear chain reaction. The quantity of neutrons produced is large in absolute numbers, allowing the pit to quickly achieve neutron levels that would otherwise need many more generations of chain reaction, though still small compared to the total number of nuclei in the pit. Boosting Before detonation, a few grams of tritium-deuterium gas are injected into the hollow “pit” of fissile plutonium or uranium. The early stages of the fission chain reaction supply enough heat and compression to start deuterium-tritium fusion, then both fission and fusion proceed in parallel, the fission assisting the fusion by continuing heating and compression, and the fusion assisting the fission with highly energetic (14.1 MeV) neutrons. As the fission fuel depletes and also explodes outward, it falls below the density needed to stay critical by itself, but the fusion neutrons make the fission process progress faster and continue longer than it would without boosting. Increased yield comes overwhelmingly from the increase in fission. The energy released by the fusion itself is much smaller because the amount of fusion fuel is so much smaller. The effects of boosting include: * increased yield (for the same amount of fission fuel, compared to detonation without boosting) * the possibility of variable yield by varying the amount of fusion fuel * allowing the bomb to require a smaller amount of the very expensive fissile material – and also eliminating the risk of predetonation by nearby nuclear explosions * allowing the primary to quickly release most of its power before it has expanded to a larger size difficult to retain within a so-called “radiation case”. * not so stringent requirements on the implosion setup, allowing for a smaller and lighter amount of high-explosives to be used The tritium in a warhead is continually undergoing radioactive decay, hence becoming unavailable for fusion. Furthermore its decay product, helium-3, absorbs neutrons if exposed to the ones emitted by nuclear fission. This potentially offsets or reverses the intended effect of the tritium, which was to generate many free neutrons, if too much helium-3 has accumulated from the decay of tritium. Therefore, it is necessary to replenish tritium in boosted bombs periodically. The estimated quantity needed is 4 grams per warhead. To maintain constant levels of tritium, about 0.20 grams per warhead per year must be supplied to the bomb. One mole of deuterium-tritium gas would contain about 3.0 grams of tritium and 2.0 grams of deuterium. In comparison, the plutonium-239 of a 4.5 kilograms of a nuclear bomb contains about 20 moles of plutonium. Tritium in hydrogen bomb secondaries Since tritium undergoes radioactive decay, and it is also difficult to confine physically, the much-larger secondary charge of heavy hydrogen isotopes needed in a true hydrogen bomb uses solid lithium deuteride as its source of deuterium and tritium, where the lithium is all in the form of the lithium-6 isotope. During the detonation of the primary fission bomb stage, excess neutrons released by the chain reaction split lithium-6 into tritium plus helium-4. In the extreme heat and pressure of the explosion, some of the tritium is then forced into fusion with deuterium, and that reaction releases even more neutrons. Since this fusion process requires an extremely-higher temperature for ignition, and it produces fewer and less energetic neutrons (only fission, deuterium-tritium fusion, and 7 3Li splitting are net neutron producers), lithium deuteride is not used in boosted bombs, but rather, for multistage hydrogen bombs. |
Nuclear weapon design – from Wikipedia
|
Two-stage thermonuclear weapons are essentially a chain of fission-boosted fusion weapons (not to be confused with the previously mentioned fusion-boosted fission weapons), usually with only two stages in the chain. The second stage, called the “secondary,” is imploded by x-ray energy from the first stage, called the “primary.” This radiation implosion is much more effective than the high-explosive implosion of the primary. Consequently, the secondary can be many times more powerful than the primary, without being bigger. The secondary can be designed to maximize fusion energy release, but in most designs fusion is employed only to drive or enhance fission, as it is in the primary. More stages could be added, but the result would be a multi-megaton weapon too powerful to serve any plausible purpose. [..] Tritium production A third important nuclear reaction is the one that creates tritium, essential to the type of fusion used in weapons and, incidentally, the most expensive ingredient in any nuclear weapon. Tritium, or hydrogen-3, is made by bombarding lithium-6 ( 6Li) with a neutron (n) to produce helium-4 ( 4He) plus tritium ( 3T) and energy: A nuclear reactor is necessary to provide the neutrons. The industrial-scale conversion of lithium-6 to tritium is very similar to the conversion of uranium-238 into plutonium-239. In both cases the feed material is placed inside a nuclear reactor and removed for processing after a period of time. In the 1950s, when reactor capacity was limited, the production of tritium and plutonium were in direct competition. Every atom of tritium in a weapon replaced an atom of plutonium that could have been produced instead. The fission of one plutonium atom releases ten times more total energy than the fusion of one tritium atom, and it generates fifty times[citation needed] more blast and fire. For this reason, tritium is included in nuclear weapon components only when it causes more fission than its production sacrifices, namely in the case of fusion-boosted fission. However, an exploding nuclear bomb is a nuclear reactor. The above reaction can take place simultaneously throughout the secondary of a two-stage thermonuclear weapon, producing tritium in place as the device explodes. Of the three basic types of nuclear weapon, the first, pure fission, uses the first of the three nuclear reactions above. The second, fusion-boosted fission, uses the first two. The third, two-stage thermonuclear, uses all three. |

Tritium Production – from FAS
|
Tritium (3H) is essential to the construction of boosted-fission nuclear weapons. A boosted weapon contains a mixture of deuterium and tritium, the gases being heated and compressed by the detonation of a plutonium or uranium device. The D-T mixture is heated to a temperature and pressure such that thermonuclear fusion occurs. This process releases a flood of 14 MeV neutrons which cause additional fissions in the device, greatly increasing its efficiency. The tritium beta decay to 3He (mean beta particle energy 5.7 keV; decay energy 18.6 keV) can be easily detected or can cause some other compound to fluoresce. Tritium is therefore used as a radioactive tracer element in biological research in the form of tritiated water (HTO or T2O) and also used in capsules surrounded by a fluorescing compound (e.g., zinc sulfide) to provide illumination which must be independent of the electricity supply. For example, it is used in emergency exit signs, self-luminous airport runway and helicopter pad lights, and light wands for use in directing traffic. The low energy of the beta decay means that tritium is not an external radiation hazard because the charged decay products are stopped by 0.2 mil of water or a similar shield. However, tritium can pose an internal radiation hazard if tritiated water vapor is inhaled or absorbed through the skin. Because of its higher mass and consequent lower chemical activity, tritium gas is less strongly absorbed by the body, whether through the lungs or the skin. Nuclear physics experiments in which tritium is compared to 3He have been important to our understanding of fundamental properties of the nuclear force. Tritium is rare in nature because of its 12.4-year half-life. It is produced by cosmic radiation in the upper atmosphere where it combines with oxygen to form water. It then falls to earth as rain, but the concentration is too low to be useful in a nuclear weapons program. Most tritium is produced by bombarding 6Li [ 6 Li(n, a) 3H] with neutrons in a reactor; it is also produced as a byproduct of the operation of a heavy-water-moderated reactor when neutrons are captured on the deuterons present. It has been suggested that it may be feasible to produce tritium in an accelerator (electronuclear breeder) in which protons bombard an appropriate target. Tritium can be stored and shipped as a gas, a metal hydride (e.g., of titanium) or tritide, and trapped in zeolites (hydrated aluminum silicate compounds with uniform size pores in their crystalline structure). Stainless-steel cylinders with capacities up to 5.6 x 10⁷ GBq (1.5 MCi) of tritium gas are used for transportation and storage and must be constructed to withstand the additional pressure which will build up as tritium gradually decays to 3 He. All five declared nuclear weapon states must have the underlying capability to manufacture and handle tritium, although the United States has shut down its production reactors due to safety considerations. Canada manufactures tritium as a byproduct of the operation of CANDU reactors. In principle, limited amounts of tritium could be made in any research reactor with the ability to accept a target to be irradiated. |
“Key Nuclear Explosive Materials” – From Institute of Science and National Security
|
What Are Isotopes? Isotopes are forms of an element which have nearly identical chemical and physical properties but different nuclear properties. The chemical properties of elements are fixed by the number of positively charged protons in their nuclei and by the corresponding number of negatively charged electrons that they carry. The isotopes of an element have nuclei containing the same number of protons but different numbers of neutrons. Neutrons are electrically neutral, and they are important in causing the nucleus to fission, releasing a relatively large amount of energy. Many isotopes are radioactive. They emit several main kinds of radiation, including: alpha particles, which carry positive charges and consist of two protons and two neutrons (the helium 4 nucleus); beta particles which are energetic electrons (negatively charged) or positrons (positively charged); and gamma rays, electromagnetic radiation which has no charge and are highly penetrating. Neutrons and various subatomic particles can also be released. A key characteristic of a radioactive isotope is its half-life, which is the time taken for a quantity of an isotope to halve through radioactive decay. Half-lives can vary from fractions of seconds to hundreds of millions of years. Fissionable Isotopes The most common isotopes in nuclear weapons are plutonium 239 and uranium 235, and each nuclear weapon in existence today uses at least several kilograms of these materials. These materials are fissile materials, which are defined technically as those isotopes that fission when irradiated with relatively low-energy, or thermal, neutrons. However, fissile materials are also commonly referred to as plutonium or highly enriched uranium (HEU). Uranium 233, which is a fissile material, is also widely recognized as a nuclear explosive material. However, it has been used only infrequently in nuclear explosives or weapons. The special role of these three isotopes has been recognized by the IAEA in its definition of “special fissionable materials,” which is plutonium 239, uranium 233, uranium enriched in the isotopes uranium 233 and uranium 235, or any material containing one or more of the foregoing. These isotopes are subject to IAEA safeguards (see section V). To define the verification goal of safeguards, the IAEA in conjunction with the nuclear weapon states, has developed the concept of significant quantity (SQ). This is the approximate amount of nuclear material sufficient to make a nuclear explosive, taking into account any losses during processing. For plutonium, containing less than 80 percent plutonium 238, the SQ is 8 kilograms of total plutonium. For uranium 233, the SQ is 8 kilograms. For highly enriched uranium, the SQ is 25 kilograms of contained uranium 235. For example, 90 percent enriched HEU, containing 25 kilograms of uranium 235, would have a total mass of 27.8 kilograms. Other isotopes can be used to make nuclear explosives. Although they are not strictly speaking fissile materials, they are fissionable and can sustain a chain reaction. Attention among members of the international community is focusing increasingly on neptunium 237 and americium, leading to more controls of these materials (2). Although the IAEA’s Board of Governors is considering applying more monitoring of these materials, it is unlikely to define these materials as special fissionable materials any time soon. Other isotopes can also be used in nuclear explosives, but they are too rare or radioactive to be worrisome. Uranium 235. Uranium (U) has 92 electrons and 92 protons (the atomic number). Of the 14 isotopes in the sequence uranium 227 to uranium 240 (the mass numbers), uranium 235 and uranium 238 are the most important. With half-lives of 700 million and 4,500 million years respectively, uranium 235 and uranium 238 are relatively stable isotopes. They are not strongly radioactive and can be handled without the need for substantial protection. Naturally occurring uranium consists of 99.283 percent (by weight) of uranium 238, 0.711 percent of uranium 235, and 0.0055 percent of uranium 234. Uranium 235 is a fissile isotope. Uranium 238 is not fissile, and no amount of it can sustain a chain reaction. It is fertile, which means it can be readily transformed into a fissile isotope by neutron irradiation. For nuclear weapons, and for fuel burned in many types of nuclear reactors, it is necessary to increase concentrations of uranium 235. This is the process known as “enrichment”. [..] The following five grades of uranium are commonly recognized: 1. Depleted uranium, containing less than 0.71 percent uranium 235. 2. Natural uranium, containing 0.71 percent uranium 235. 3. Low-enriched uranium (LEU), containing more than 0.71 percent and less than 20 percent uranium 235. 4. Highly enriched uranium (HEU), containing more than 20 percent uranium 235. 5. Weapon-grade uranium, HEU containing more than 90 percent uranium 235. LEU used to fuel commercial power reactors generally contains 2-6 percent uranium 235. Research and naval reactors use either LEU or HEU fuel. LEU cannot be used to make nuclear explosives; HEU can be used to make nuclear explosives. For fission-type nuclear weapons, weapon-grade uranium is usually desired. However, fission-type nuclear explosives can be made with any highly enriched uranium. For example, South Africa’s nuclear weapons, since dismantled, used both 80 percent enriched uranium and weapon-grade uranium. In addition, the secondary in a thermonuclear weapon may also use HEU to trigger the thermonuclear explosion. Uranium 233. This isotope, which is created by irradiating thorium 232 with neutrons, has a half-life of 160,000 years. It is a fissile material that has been evaluated for use in nuclear weapons, although it has not become a common nuclear explosive material. It has also been evaluated as reactor fuel, via the thorium fuel cycle, but this fuel cycle has not advanced beyond the research and development stage. Plutonium isotopes. Unlike uranium, all but trace quantities of plutonium (Pu) are manufactured material. The most common plutonium isotopes are highly radioactive, complicating their handling. Plutonium 239 is produced in a nuclear reactor when uranium 238 is irradiated with neutrons. Its half-life is 24,000 years, and it is a fissile material. When it absorbs neutrons in a reactor, plutonium 240 is formed. Subsequent neutron captures lead to accumulations of plutonium 241 and plutonium 242. Plutonium 241 is fissile, but plutonium 240 and plutonium 242 are not. However, all of these plutonium isotopes are fissionable by fast neutrons, and thus can be used either in combination or alone in nuclear explosives. Although the weapon designer’s preference is always for material with high concentrations of plutonium 239 and low fractions of other plutonium isotopes, militarily useful weapons can be made out of plutonium with low concentrations of plutonium 239 and high concentrations of plutonium 240, plutonium 241, or plutonium 242. The plutonium used in nuclear weapons typically contains mostly plutonium 239 and relatively small fractions of other plutonium isotopes. Plutonium discharged in power reactor fuel typically contains significantly less plutonium 239 and more of other plutonium isotopes. The following grades of plutonium are widely used: 1. Weapon-grade plutonium, containing less then 7 percent plutonium 240. 2. Fuel-grade plutonium, containing from 7 to 18 percent plutonium 240. 3. Reactor-grade plutonium, containing over 18 percent plutonium 240. The term “super-grade plutonium” is sometimes used to describe plutonium containing less than 3 percent plutonium 240. The term “weapon-usable plutonium” is often used to describe plutonium that is in separated form and, thus able to be quickly turned into weapons components (see key terms). Neptunium 237. Neptunium 237 (Np 237) has a half-life of over 2 million years and has no heat or radiation properties that would complicate its use in a nuclear explosive. No country is known publicly to have used neptunium to make a nuclear explosive device, although it is considered usable in nuclear weapons. Neptunium 237 is routinely produced in nuclear reactors as a result of neutron irradiation of uranium 235 and uranium 238, the two most common constituents of nuclear fuel. It is also a decay product of americium 241. However, relatively little neptunium 237 has been extracted from irradiated fuel, unlike the case of plutonium. Americium. The common americium (Am) isotopes are generally less suitable than neptunium 237 for making nuclear explosives, because of their higher output of radiation and heat. The three most important isotopes are americium 241, americium 242m, and americium 243. Several americium isotopes originate as a result of neutron irradiation in reactors; americium 241 originates from the decay of plutonium 241. The total americium content of fresh spent fuel is modest, although over time considerable amounts of americium 241 accumulate. Other isotopes. Several other isotopes, such as curium (Cm) and californium (Cf), can be used to make nuclear explosives. However, these isotopes are too rare, particularly in separated form, or too radioactive to be considered as realistic materials for nuclear explosives for at least several decades. Tritium Some have suggested including tritium in a treaty, although it is neither fissile nor fissionable material. Tritium is the heaviest isotope of hydrogen, containing one proton and two neutrons. It has a half-life of 12.3 years. Although tritium is not essential to making nuclear weapons or explosives, it serves two purposes in designing nuclear weapons. In a fission weapon, tritium is used to increase the yield of the weapon in a process known as boosting. In a common form of boosting, tritium and deuterium are fused in the hollow sphere of the fissile core known as the “pit.” When tritium and deuterium fuse, they produce many high-energy neutrons, which then set off additional fissions in the fissile core of the weapon. Using tritium in nuclear weapons can either lessen the amount of fissile material required or increase, or “boost,” the yield of the weapon. Tritium is also created in the secondary stage of a thermonuclear weapon and is critical to creating the fusion explosion that distinguishes thermonuclear weapons from fission weapons. After the first, or fission, stage of a thermonuclear weapon detonates, tritium is produced in lithium 6 in the secondary stage of the weapon. The tritium then fuses with deuterium in the second stage to create a fusion explosion. In the nuclear weapon states, tritium has been commonly produced in nuclear reactors by bombarding lithium 6 with neutrons (see appendix III, figure III.A.1). Tritium can also be extracted from irradiated heavy water that has been used to moderate or cool certain types of reactors. In this case, tritium is produced by neutron irradiation of deuterium, which is a hydrogen isotope that contains one proton and one neutron and that substitutes for common hydrogen in water. (1) This section draws heavily from David Albright, Frans Berkhout, and William Walker, Plutonium and Highly Enriched Uranium 1996: World Inventories, Capabilities, and Policies (Oxford: SIPRI and Oxford University Press, 1997), chapter 2. (2) David Albright and Lauren Barbour, “Separated Neptumium and Americium,” in The Challenges of Fissile Material Control (Washington D.C.: ISIS, 1999) chapter 5. http://www.isis-online.org/publications/fmct/primer/Section_I.html (Institute of Science and International Security) |
Fusion Weapons – from FAS
|
A more powerful but more complex weapon uses the fusion of heavy isotopes of hydrogen, deuterium, and tritium to release large numbers of neutrons when the fusile (sometimes termed “fusionable”) material is compressed by the energy released by a fission device called a primary. Fusion (or “thermonuclear”) weapons derive a significant amount of their total energy from fusion reactions. The intense temperatures and pressures generated by a fission explosion overcome the strong electrical repulsion that would otherwise keep the positively charged nuclei of the fusion fuel from reacting. The fusion part of the weapon is called a secondary. In general, the x-rays from a fission primary heat and compress material surrounding a secondary fusion stage. It is inconvenient to carry deuterium and tritium as gases in a thermonuclear weapon, and certainly impractical to carry them as liquefied gases, which requires high pressures and cryogenic temperatures. Instead, one can make a “dry” device in which Li-6 is combined with deuterium to form the compound Li-6 D (lithium-6 deuteride). Neutrons from a fission “primary” device bombard the Li-6 in the compound, liberating tritium, which quickly fuses with the nearby deuterium. The a particles, being electrically charged and at high temperatures, contribute directly to forming the nuclear fireball. The neutrons can bombard additional Li-6 nuclei or cause the remaining uranium and plutonium in the weapon to undergo fission. This two-stage thermonuclear weapon has explosive yields far greater than can be achieved with one point safe designs of pure fission weapons, and thermonuclear fusion stages can be ignited in sequence to deliver any desired yield. Such bombs, in theory, can be designed with arbitrarily large yields: the Soviet Union once tested a device with a yield of about 59 megatons. In a relatively crude sense, Li-6 can be thought of as consisting of an alpha particle (He-4) and a deuteron (H-2) bound together. When bombarded by neutrons, Li-6 disintegrates into a triton (H-3) and an alpha: Li-6 + Neutron = H-3 + He-3 + Energy. This is the key to its importance in nuclear weapons physics. The nuclear fusion reaction which ignites most readily is H-2 + H-3 = He-4 + n + 17.6 MeV, or, phrased in other terms, deuterium plus tritium produces He-4 plus a neutron plus 17.6 MeV of free energy: D + T = He-4 + n + 17.6 MeV Lithium-7 also contributes to the production of tritium in a thermonuclear secondary, albeit at a lower rate than 6Li. The fusion reactions derived from tritium produced from Li-7 contributed many unexpected neutrons (and hence far more energy release than planned) to the final stage of the infamous 1953 Castle/BRAVO atmospheric test, nearly doubling its expected yield. |
Israel produces tritium
|
The large scale production of tritium by Israel has been confirmed by South Africa, which received a shipments of tritium totalling 30 g during 1977-79. This clearly indicates tritium production on a scale sufficient for a weapon boosting program. It is difficult to find any other rationale for such a large tritium production capability except some sort of thermonuclear weapon application. |
Israel’s involvement with nuclear technology
From Nuclear Weapon Archive
|
Israel’s involvement with nuclear technology literally extends back to the founding of the country in 1948. A host of talented scientists emigrated to Palestine during the thirties and forties, particularly one Ernst David Bergmann – later the director of the Israeli Atomic Energy Commission and the founder of Israel’s efforts to develop nuclear weapons. The Weizmann Institute of Science actively supported nuclear research by 1949, with Bergmann heading its chemistry division. Also in 1949, Francis Perrin – French nuclear physicist, atomic energy commissioner, and personal friend of Bergmann’s – visited the Weizmann Institute, after which Israeli scientists were invited to the newly established French nuclear research facility at Saclay. A joint research effort was subsequently set up between the two nations. At this time France’s nuclear research capability was quite limited. France had been a leading research center in nuclear physics before the war, but had fallen far behind developments in the U.S., the USSR, Britain, and even Canada. Israel and France were thus at a similar level of expertise at the time, and it was possible for Israeli scientists to make valuable contributions. Consequently the development of nuclear science and technology in France and Israel remained closely linked in the early fifties, for example Israeli scientists were involved in the construction of the G-1 plutonium production reactor and UP1 reprocessing plant at Marcoule. In the 1950s and early 1960s, France and Israel had very close relations. France was Israel’s principal arms supplier, and as instability spread in France’s colonies in North Africa, Israel provided valuable intelligence obtained from its contacts with sephardic Jews in those countries. The two nations even collaborated (along with Britain) in planning and staging the joint Suez-Sinai operation against Egypt in October 1956. The Suez Crisis, as it became known, proved to be the genesis of Israel’s nuclear weapons production program. Six weeks before the operation Israel felt the time was right to approach France for assistance in building a nuclear reactor. Canada had set a precedent a year earlier when it had agreed to build the 40 MW CIRUS reactor in India. Shimon Peres, a key aide to Prime Minister (and Defense Minister) David Ben Gurion, and Bergmann met with members of the CEA (France’s Atomic Energy Commission). An initial understanding to provide a research reactor appears to have been reached during September. On the whole the Suez operation, launched on 29 October was a disaster. Although Israel’s part of the operation was a stunning success, allowing it to occupy the entire Sinai peninsula by 4 November, the French and British invasion on 6 November was a failure. The attempt to advance along the Suez canal bogged down and then collapsed under fierce U.S. and Soviet pressure. Both European nations pulled out, leaving Israel to face the pressure from the two superpowers alone. Soviet premier Bulganin issued an implicit threat of nuclear attack if Israel did not withdraw from the Sinai. On 7 November 1956, a secret meeting was held between foreign minister Golda Meir, Peres, and French foreign and defense ministers Mssrs. Christian Pineau and Maurice Bourges-Manoury. The French officials were deeply chagrined by France’s failure to support its ally in the operation, and the Israelis were very concerned about the Soviet threat. In this meeting the initial understanding about a research reactor may have been substantially modified, and Peres seems to have secured an agreement to assist Israel in developing a nuclear deterrent. After some further months of negotiation, the initial agreement for assistance took the form of an 18 MW (thermal) research reactor of the EL-3 type, along with plutonium separation technology. At some point this was officially upgraded to 24 MW, but the actual specifications issued to engineers provided for core cooling ducts sufficient for up to three times this power level, along with a plutonium plant of similar capacity. How this upgrade came about remains unknown. The reactor was secretly built underground at Dimona, in the Negev desert of southern Israel near Beersheba. Hundreds of French engineers and technicians filled Beersheba which, although it was the biggest town in the Negev, was still a small town. Many of the same contractors who built Marcoule were involved, for example the plutonium separation plants in both France and Israel were built by SGN. The Ground was broken for the EL-102 reactor (as it was known to France) in early 1958. The heavy water for the reactor was purchased from Norway, which sold 20 tons to Israel in 1959 allegedly for use in an experimental power reactor Norway insisted on the right to inspect the heavy water for peaceful use for 32 years, but was permitted to do so only once, in April 1961, prior to it being loaded into the Dimona reactor tank. Israel used a variety of subterfuges to explain away the activity at Dimona – calling it a “manganese plant” among other things (although apparently not a “textile plant” as most accounts claim). U.S. intelligence became aware of the project before the end of 1958, took picture of the project from U-2 spy planes, and identified the site as a probable reactor complex. The concentration of Frenchmen was certainly impossible to hide. In 1960, before the reactor was operating, France, now under the leadership of de Gaulle, reconsidered the deal and decided to suspend the project. After several months of negotiation, an agreement was reached in November that allowed the reactor to proceed if Israel promised not the make weapons and announced the project to the world, work on the plutonium plant halted. On 2 December 1960, before Israel could make the announcement, the U.S. State Department issued a determination that Israel had a secret nuclear installation. By 16 December this became public knowledge with its appearance in the New York Times. On 21 December Ben Gurion announced that Israel was building a 24 MW reactor “for peaceful purposes”. Over the next year the relationship between the U.S. and Israel was strained over the issue. The U.S. accepted Israel’s claims at face value in public, but exerted pressure privately. Although Israel did allow a cursory inspection by physicists Eugene Wigner and I.I. Rabi, PM Ben Gurion consistently refused to allow international inspections. The final resolution was a commitment from Israel to use the facility for peaceful purposes, and an agreement to admit a U.S. inspection team once a year. These inspections, begun in 1962 and continued until 1969, were only shown the above-ground part of the buildings, which continued down many levels underground. The above ground areas had simulated control rooms, and access to the underground areas was kept bricked up while the inspectors where present. The most favorable interpretation that can be given to adherence to the pledge is that it has apparently been interpreted by Israel to mean that nuclear weapon development is not excluded if they are used strictly for defensive, and not aggressive purposes. It should be remembered though that Israel’s security position in the late fifties and early sixties when the nuclear program was taking shape was far more precarious than it subsequently became after the Six Day War, the establishment of a robust domestic arms industry, and a reliable defense supply line from the U.S.. During the fifties and early sixties a number of attempts by Israel to obtain security guarantees from the U.S., thus effectively placing Israel under the U.S. nuclear umbrella in a manner similar to NATO or Japan, were rebuffed. If an active policy to restrain Israel’s proliferation had been undertaken, along with a secure defense agreement, the development of a nuclear arsenal might have been preventable. [Eliminate.] In 1962 the Dimona reactor went critical, and the French resumed work on the plutonium plant, believed to have been completed in 1964 or 1965. The acquisition of this reactor and related technologies was clearly intended for military purposes from the outset (not “dual use”) as the reactor has no other function. The security at Dimona (officially the Negev Nuclear Research Center) is stringent, an IAF Mirage was actually shot down in 1967 for straying into Dimona’s airspace. There is little doubt then, that some time in the late sixties Israel became the sixth nation to manufacture nuclear weapons. According to Seymour Hersh, PM Levi Eshkol delayed starting nuclear weapons production even after the Dimona facility was finished. The reactor remained in operation so the plutonium continued to accumulate, whether it was separated or not. It is generally believed that the first extraction of plutonium occurred in 1965, and that enough plutonium was on hand for one weapon during the Six Day War in 1967 although whether a prototype weapon actually existed or not is unknown. Hersh relates that Moshe Dayan gave the go-ahead for starting weapon production in early 1968, which is when the plutonium separation plant presumably went into full operation. After this Israel began producing three to five bombs a year. William Burroms and Robert Windrem, on the other hand, assert in Critical Mass that Israel actually had two bombs available for use in 1967, and that Eshkol actually ordered them armed in Israel’s first nuclear alert during the Six Day War. Israel began purchasing Krytrons in 1971. These are ultra high speed electronic switching tubes that are “dual use”, having both industrial and nuclear weapons applications. At 2 p.m. (local) on 6 October 1973 Egypt and Syria attacked Israel in a coordinated surprise attack, starting the Yom Kippur War. Caught with only their standing forces on duty, and these at a low level of readiness, the Israeli front lines were overrun. By early afternoon on 7 October no defensive forces were left in the southern Golan Heights and Syrian forces had reached the edge of the plateau, within sight of the Jordan River. It has been widely reported that this crisis brought Israel to its first nuclear alert. Hersh reports that the decision was made by PM Golda Meir and her “kitchen cabinet” on the night of 8 October. This resulted in the Jericho missiles at Hirbat Zachariah and the nuclear strike F-4s at Tel Nof being armed and prepared for action against Syrian and Egyptian targets. US Sec. of State Henry Kissinger was apparently notified of this alert several hours later on the morning of 9 October, which helped motivate a U.S. decision to promptly open a resupply pipeline to Israel (Israeli aircraft began picking up supplies that day, the first U.S. flights arrived on 14 October). Though stockpile depletion remained a concern, the military situation stabilized on October 8 and 9 as Israeli reserves poured into the battle and disaster was averted. Well before significant resupply had reached Israeli forces, the Israelis counterattacked and turned the tide on both fronts. On 11 October a counterattack on the Golan broke the back of Syria’s offensive, and on October 15 and 16 Israel launched a surprise crossing of the Suez Canal. Soon the Egyptian Third Army was faced with encirclement and annihilation, with no protective forces remaining between the Israeli Army and Cairo. This prompted Leonid Brezhnev to threaten, on 24 October, to airlift Soviet troops to reinforce the Egyptians. Pres. Nixon’s response was to bring the U.S. to world-wide nuclear alert the next day, whereupon Israel went to nuclear alert a second time (according to Hersh; Burrows and Windrem do not recognize this alert). This sudden crisis quickly faded as PM Meir agreed to a ceasefire, relieving the pressure on the Egyptians. Considerable nuclear collaboration between Israel and South Africa seems to have developed around 1967 and continued through the 70s and 80s. During this period SA was Israel’s primary supplier of uranium for Dimona. An open question remains regarding what role Israel had (if any) in the 22 September 1979 nuclear explosion in the south Indian Ocean which is widely believed to be a SA-Israel joint test. This relationship is discussed more fully in the section on South Africa. Hersh relates extensive (and highly successful) efforts by Israel to obtain targeting data from U.S. intelligence. Much satellite imaging data of the Soviet Union was obtained through the American spy Jonathan Pollard, apparently indicating Israel’s intention to use its nuclear arsenal as a deterrent, political lever, or retaliatory capability against the Soviet Union itself. Satellite imagery from a U.S. KH-11 satellite for example was used to plan the 7 June 1981 attack on the Tammuz-1 reactor at Osiraq, Iraq. This attack, carried out by 8 F-16s accompanied by 6 F-15s punched a hole in the concrete reactor dome before the reactor began operation (and just days before an Israeli election) and delivered 15 delay-fuzed 2000 lb bombs deep into the reactor structure (the 16th bomb hit a nearby hall). The blasts shredded the reactor and blew out the dome foundations, causing it to collapse on the rubble. This was the world’s first attack on a nuclear reactor. Since 19 September 1988 Israel has had its own satellite reconnaissance system and thus no longer needs to rely on U.S. sources. On that day the Offeq-1 satellite was launched on the Shavit booster, a system closely related to the Jericho-2 missile. Offeq-2 went up on 3 April 1990. The launch of the Offeq-3 failed on its first attempt on 15 September 1994, but was retried successfully 5 April 1995. On 22 January 1998 an attempt to launch the Offeq-4, timed to coincide with the ending of service by Offeq-3, also failed. Both Hersh and Burrows and Windrem agree that Israel went on full scale nuclear alert again on the first day of Desert Storm, 18 January 1991, when 7 Scud missiles were fired against the cities of Tel Aviv and Haifa by Iraq (only 2 actually hit Tel Aviv and 1 hit Haifa). This alert apparently lasted for the duration of the war (43 days). Threats of retaliation by the Shamir government if the Iraqis used chemical warheads are interpreted to mean that Israel intended to launch a nuclear strike if gas attacks occurred. The principal uncertainty in evaluating Israel’s weapon production capability is the actual power level of the Dimona reactor. It has long been believed that Israel has upgraded the reactor repeatedly to increase its plutonium production. The only inside account of the program from a publicly named source is that of Mordecai Vanunu, whose story was published by the London Sunday Times on 5 October 1986. Vanunu was a mid-level technician in the Machon 2 complex at Dimona for 9 years, who claimed that Israel possessed 100-200 nuclear weapons (implying some 400-800 kg of plutonium) and can produce 40 kg of plutonium a year. This production figure indicates an average operating power of 150 MW thermal. Analysts generally discount figures this high, and the consensus is that it was initially operated at 40 MW and was upgraded to 70 MW sometime before 1977. A 1996 study by the Stockholm International Peace Research Institute (SIPRI) produced a somewhat lower range of estimates, concluding that Israel has produced 330-580 kg of plutonium through 1995, enough for a stockpile of 80-150 efficient weapons (the extreme estimate range was 190 to 880 kg). Vanunu provided information indicating that the uranium fuel is subjected to burnups of 400 MW-days/tonne, a figure similar to that used by the U.S. early in its weapons production program. This results in a high grade plutonium with a Pu-240 content of 2%. According to Vanunu 140 fuel rods are irradiated for periods of about three months before discharge for plutonium extraction. At 70 MW the Dimona reactor would consume some 48 tonnes of fuel a year and produce about 18 kg of plutonium. Vanunu also claimed that Israel possessed fusion boosted weapons, and has developed hydrogen bomb technology. He provided information about both lithium-6 and tritium production. He stated that initially tritium was produced by a facility in Machon 2 called Unit 92 by separating it from the heavy water moderator where it is produced in small amounts as a by-product. In 1984 production was expanded when a new facility called Unit 93 was opened to extract tritium from enriched lithium that had been irradiated in the reactor. The large scale production of tritium by Israel has been confirmed by South Africa, which received a shipments of tritium totalling 30 g during 1977-79. This clearly indicates tritium production on a scale sufficient for a weapon boosting program. It is difficult to find any other rationale for such a large tritium production capability except some sort of thermonuclear weapon application. [IMPORTANT] It is quite difficult to develop gas fusion boosting technology like that used in U.S. weapons and weapons tests are probably essential. Although radiation implosion weapons could be developed without testing, they would tend to be large and heavy and would perhaps be incompatible with Israel’s available delivery systems. It is quite possible then that a Sloika/Alarm Clock type system has been developed using lithium-6 deuteride fuel surrounding the plutonium core (in fact a weapon mock-up photographed by Vanunu appears to be this type of weapon). Tritium could be used to spike the fusion fuel and boost the yield, just as the Soviets did with the 400 kt “Joe-4”. Bomb components made of plutonium, lithium-6 deuteride, and beryllium are fabricated in level 5 of Machon 2. They are transported by convoys of unmarked cars to the warhead assembly facility, operated by Rafael north of Haifa. Hersh reports (without any stated source) that Israel has developed an extensive array of tactical nuclear weapons: efficient compact boosted fission bombs, neutron bombs (allegedly numbering in the hundreds by the mid-eighties), nuclear artillery shells, and nuclear mines. With an arsenal that is quite possibly in excess of 100 weapons it is likely that some of the nuclear materials would be applied tactical weapons. Boosted bombs are doubtful, as are neutron bombs, due to problems with development in the absence of a significant testing program. Neutron bombs also require very large amounts of tritium (20-30 g per weapon) which would impact the production of plutonium quite seriously (each gram of tritium displaces 80 grams of plutonium production). Artillery shells are also doubtful due to their wastefulness in plutonium. Tactical weapons are probably aircraft or missile delivered, or are pre-emplaced mines. Burrows and Windrem claim (without indicating a source) that Israel has produced 300 warheads, including those that have since been dismantled. They place the current arsenal at about 200 weapons. Several reports have surfaced claiming that Israel has some uranium enrichment capability at Dimona. Vanunu asserted that gas centrifuges were operating in Machon 8, and that a laser enrichment plant was being operated in Machon 9 (Israel holds a 1973 patent on laser isotopic enrichment). According to Vanunu the production-scale plant has been operating since 1979-80. The scale of a centrifuge operation would necessarily be limited due to space constraints, and might be focused toward enriching depleted reactor fuel to more efficiently use Israel’s uranium supply. A laser enrichment system, if developed to operational status, could be quite compact however and might be producing weapon grade material in substantial quantities. If highly enriched uranium is being produced in substantial quantities, then Israel’s nuclear arsenal could be much larger than estimated solely from plutonium production. Reports that Zalman Shapiro, the American owner of the nuclear fuel processing company NUMEC, supplied enriched uranium to Israel in the 1960s seems to have been authoritatively refuted by Hersh. Israel produces uranium domestically as a by-product of phosphate mining near the Dead Sea but this amounts to only 10 tons a year, and is grossly insufficient for its needs. Israel has addressed this shortfall by reprocessing the low burnup spent fuel to recover uranium (which most nations do not do). It is also known to have purchased at least 200 tons of natural uranium on the world market under an alias. A major source though was some 600 tons of uranium provided by South Africa in a quid pro quo for Israel’s assistance on its weapons program. Combined with uranium recycling, and the possible use of enrichment to stretch the uranium supply, these quantities may be sufficient to account for Dimona’s fuel supply to the present date (1997). Israel can undoubtedly deploy nuclear weapons using its capable air force. The aircraft and crews dedicated to nuclear weapons delivery are located at the Tel Nof airbase. Originally the F-4 Phantom II acquired in 1969 was probably the designated carrier, today it would be the F-16. The F-16 has an unrefueled radius of action of 1250 km, extending out to western Iran, the shores of the Black Sea, Riyadh, or the Libyan border. With refueling it can travel much farther of course, and an unrefueled one-way mission could take it as far as Moscow. Israel also possesses medium-range ballistic missiles: the Jericho-1 (Ya-1 “Luz”) with a 500 kg payload, and a range of 480-650 km (operational since 1973); and the Jericho 2 (either Ya-2 or Ya-3) with a 1000 kg payload and a range of over 1500 km (operational since 1990). Under development is the Jericho-2B with a range of 2,500 km. These missiles were almost certainly developed specifically as nuclear delivery systems (although chemical warheads cannot be ruled out). About 50 Jericho-1s and 50 Jericho-2s are believed to have been deployed. Israel also has a 100 or more U.S. supplied Lance tactical missiles, with a range of 115 km (72 miles). Although these were supplied with conventional warheads, they could have been outfitted with nuclear or chemical ones. Both the Jericho 1 and 2 are two stage solid-propellant missiles. The Jericho-1 is about 10 m long, 1 m wide, and weighs 4500 kg. The Jericho-2 is about 12 m long, and 1.2 m wide with a launch weight of 6500 kg. The Jericho-1 was developed in the mid-sixties with French assistance. It is believed to be based on the Dassault MD-600. Jericho-2 development is indigenous, and started soon after the Jericho-1 was deployed. Test launches began in 1986 and the first two had ranges of 465 km (1986) and 820 km (1987). The Jericho-2 shares the first two stages of the civilian Shavit (Comet) space launch vehicle, which launched Israel’s first satellite, the Offeq-1, in September 1988. The Jericho 1 and 2 are deployed near Kfar Zachariah and Sderot Micha in the Judean foothills, about 23 km west of Jerusalem (and about 40 km southeast of Tel Aviv). Located a few kilometers to the northwest is Tel Nof air base. Images of the missile complex made by commercial satellites have been published in recent years, and September 1997 Jane’s Intelligence Review published a 3-D analysis of high resolution pictures taken by the Indian IRS-C satellite. The complex is compact – smaller than 6 km x 4 km. The missiles are mobile, being deployed on transporter-erector-launchers (TELs), and are based in bunkers tunneled into the side of the limestone hills. There are no signs of missile silos. TELs require firm, accurately leveled ground in order to launch, and maximum missile accuracy requires pre-surveyed launch points. Consequently there are a number of prepared launch pads (paved culs-de-sac) connected to these bunkers by paved roads. Images of an actual Jericho 2 TEL indicate that it is about 16 m long, 4 m wide, and 3 m high. It is accompanied by three support vehicles (probably a power supply vehicle, a firing control vehicle, and a communications vehicle). The Zachariah missile base was enlarged between 1989 and 1993 during the Jericho-2 deployment. A few kilometers north of Tel Nof is the IAI’s MLM Division plant in Be’er Ya’acov where the Jericho and Arrow missiles and the Shavit are manufactured. In April 1997 this factory suffered a serious fire. From its deployment location in central Israel the Jericho-1 missile can reach such targets as Damascus, Aleppo, and Cairo. The Jericho-2 can reach any part of Syria or Iraq, and as far as Teheran, and Benghazi, Libya. The Jericho-2B will be able to reach any part of Libya or Iran, and as far as southern Russia. The short range of the Lance limits it mainly to battlefield use, although the Syrian capital of Damascus is in range from much of northern Israel. According to Jane’s World Air Forces, Israel has three Jericho-equipped missile squadrons. Also located at the site are a group of 21 bunkers thought to contain nuclear gravity bombs. Five of the larger ones are about 15 m wide and 20 m long, and rise 6 m above ground. Israel has taken active steps to prevent nations that are officially at war with it from acquiring nuclear capabilities. The bombing of the Tammuz-1 reactor at Osiraq in Iraq in 1981 is the most famous case, but an earlier successful sabotage of the reactor core in France prior to shipment is no doubt attributable to Mossad. Israel’s official policy is that it will not be the first nation to introduce nuclear weapons into the Middle East. In contrast to the coy hinting practiced in the past by some undeclared weapon’s states, Israel thus actively denies possessing nuclear weapons. Its obvious capability in this regard has thus established de facto deterrence, while minimizing (but not eliminating) domestic and international controversy.
http://nuclearweaponarchive.org/Israel/Dimonacntrl.jpg URL: http://nuclearweaponarchive.org/Israel/index.html Israel’s Nuclear Weapons Program Caption: Control room of the Machon 2 plutonium separation plant (courtesy Mordechai Vanunu)
http://nuclearweaponarchive.org/Israel/Isrbmbmodel.jpg URL: http://nuclearweaponarchive.org/Israel/index.html Israel’s Nuclear Weapons Program Caption: Mock-up of an Israeli Bomb (courtesy Mordechai Vanunu)
http://nuclearweaponarchive.org/Israel/4_dim_01.jpg URL: http://nuclearweaponarchive.org/Israel/index.html Caption: This is an image of the Dimona facility taken by a US Corona spy satellite in 1971 (Mission 1115-2, 29 September 1971, Frame: 52, 53). It is physically impossible to take a similar image within the atmosphere as Israel jealously protects the airspace above Dimona. In the 1960s an Israeli Airforce Mirage was shot down when it accidentally ventured too close to Dimona.
http://nuclearweaponarchive.org/Israel/4_dim_03.jpg URL: http://nuclearweaponarchive.org/Israel/index.html Caption: This is an image of the Dimona facility taken by a US Corona spy satellite in 1971 (Mission 1115-2, 29 September 1971, Frame: 52, 53). – A close-up.
http://nuclearweaponarchive.org/Israel/Dimona_compare.jpg URL: http://nuclearweaponarchive.org/Israel/index.html Caption: Side-by-side comparison of a Corona image and the much lower resolution SPOT commercial imaging satellite. The SPOT image lables the Dimona nuclear reactor dome and Machon 2 which houses the plutonium separation plant.
http://nuclearweaponarchive.org/Israel/Dimona1.jpg URL: http://nuclearweaponarchive.org/Israel/index.html Caption: The Dimona Reactor Dome (courtesy Mordechai Vanunu)
http://nuclearweaponarchive.org/Israel/Vanunu2.jpg URL: http://nuclearweaponarchive.org/Israel/index.html Caption: Mordechai Vanunu
http://nuclearweaponarchive.org/Israel/Shavit.jpg URL: http://nuclearweaponarchive.org/Israel/index.html Caption: Shavit space launch vehicle, Offeq-2 launch on 3 April 1990 (13 K) Specifications |


New Reports of Israeli-South African Nuclear Collaboration
|
April 21, 1997 According to a report published in the Israeli daily paper Ha’aretz on Sunday April 20, 1997. Israel assisted South Africa in developing nuclear weapons in the early 1980s. The paper based its report on interviews with South African officials, including Deputy Foreign Minister Aziz Pahad, and retired Gen. Constand Viljoen, who was South African chief of staff from 1980-1985, the period during which nuclear weapon development took place. Speculation about such cooperation has been rife since the detection of a suspected nuclear test over the South Atlantic in 1979 (never tied to any country). Firm information about at least indirect nuclear cooperation between the two countries has been available since South Africa declassified its weapon program in 1993. South Africa has previously revealed receiving gram quantities of tritium, a critical material for advanced weapons, from Israel but authoritative reports of direct collaboration in weapon development has so far been lacking. Pahad, however, told Haaretz that Israeli and South African scientists cooperated “on very specific equipment” designed for military use. “The nuclear issue was top secret and many documents were destroyed,” Pahad said. He could not be reached by the Associated Press for further comment. However, aides said that the deputy foreign minister has made similar statements in the past. Viljoen, was quoted as saying, “We wanted to get nuclear knowledge from whoever we could, also from Israel.” Haaretz also cited past reports that Israel purchased 550 tons of uranium from South Africa for its own nuclear plant in Dimona. In exchange, Israel supplied South Africa with nuclear know-how and material to increase the power of nuclear warheads, the newspaper said. (Reports from Associated Press were used in preparing this article.) |
Two-stage thermonuclear weapons – from Wikipedia
|
Pure fission or fusion-boosted fission weapons can be made to yield hundreds of kilotons, at great expense in fissile material and tritium, but by far the most efficient way to increase nuclear weapon yield beyond ten or so kilotons is to tack on a second independent stage, called a secondary. In the 1940s, bomb designers at Los Alamos thought the secondary would be a canister of deuterium in liquified or hydride form. The fusion reaction would be D-D, harder to achieve than D-T, but more affordable. A fission bomb at one end would shock-compress and heat the near end, and fusion would propagate through the canister to the far end. Mathematical simulations showed it wouldn’t work, even with large amounts of prohibitively expensive tritium added in. The entire fusion fuel canister would need to be enveloped by fission energy, to both compress and heat it, as with the booster charge in a boosted primary. The design breakthrough came in January 1951, when Edward Teller and Stanisław Ulam invented radiation implosion—for nearly three decades known publicly only as the Teller-Ulam H-bomb secret. The concept of radiation implosion was first tested on May 9, 1951, in the George shot of Operation Greenhouse, Eniwetok, yield 225 kilotons. The first full test was on November 1, 1952, the Mike shot of Operation Ivy, Eniwetok, yield 10.4 megatons. In radiation implosion, the burst of X-ray energy coming from an exploding primary is captured and contained within an opaque-walled radiation channel which surrounds the nuclear energy components of the secondary. The radiation quickly turns the plastic foam that had been filling the channel into a plasma which is mostly transparent to X-rays, and the radiation is absorbed in the outermost layers of the pusher/tamper surrounding the secondary, which ablates and applies a massive force[19] (much like an inside out rocket engine) causing the fusion fuel capsule to implode much like the pit of the primary. As the secondary implodes a fissile “spark plug” at its center ignites and provides heat which enables the fusion fuel to ignite as well. The fission and fusion chain reactions exchange neutrons with each other and boost the efficiency of both reactions. The greater implosive force, enhanced efficiency of the fissile “spark plug” due to boosting via fusion neutrons, and the fusion explosion itself provides significantly greater explosive yield from the secondary despite often not being much larger than the primary. A Warhead before firing; primary at top, secondary at bottom. Both components are fusion-boosted fission bombs. B High-explosive fires in primary, compressing plutonium core into supercriticality and beginning a fission reaction. C Fission in primary emits X-rays which channel along the inside of the casing, irradiating the polystyrene foam channel filler. D Secondary compressed by X-ray induced ablation, and Plutonium sparkplug inside the secondary begins to fission, supplying heat. E Compressed and heated, lithium-6 deuteride fuel begins fusion reaction, neutron flux causes tamper to fission. A fireball is starting to form… For example, for the Redwing Mohawk test on July 3, 1956, a secondary called the Flute was attached to the Swan primary. The Flute was 15 inches (38 cm) in diameter and 23.4 inches (59 cm) long, about the size of the Swan. But it weighed ten times as much and yielded 24 times as much energy (355 kilotons, vs 15 kilotons). Equally important, the active ingredients in the Flute probably cost no more than those in the Swan. Most of the fission came from cheap U-238, and the tritium was manufactured in place during the explosion. Only the spark plug at the axis of the secondary needed to be fissile. A spherical secondary can achieve higher implosion densities than a cylindrical secondary, because spherical implosion pushes in from all directions toward the same spot. However, in warheads yielding more than one megaton, the diameter of a spherical secondary would be too large for most applications. A cylindrical secondary is necessary in such cases. The small, cone-shaped re-entry vehicles in multiple-warhead ballistic missiles after 1970 tended to have warheads with spherical secondaries, and yields of a few hundred kilotons. As with boosting, the advantages of the two-stage thermonuclear design are so great that there is little incentive not to use it, once a nation has mastered the technology. In engineering terms, radiation implosion allows for the exploitation of several known features of nuclear bomb materials which heretofore had eluded practical application. For example: * The best way to store deuterium in a reasonably dense state is to chemically bond it with lithium, as lithium deuteride. But the lithium-6 isotope is also the raw material for tritium production, and an exploding bomb is a nuclear reactor. Radiation implosion will hold everything together long enough to permit the complete conversion of lithium-6 into tritium, while the bomb explodes. So the bonding agent for deuterium permits use of the D-T fusion reaction without any pre-manufactured tritium being stored in the secondary. The tritium production constraint disappears. * For the secondary to be imploded by the hot, radiation-induced plasma surrounding it, it must remain cool for the first microsecond, i.e., it must be encased in a massive radiation (heat) shield. The shield’s massiveness allows it to double as a tamper, adding momentum and duration to the implosion. No material is better suited for both of these jobs than ordinary, cheap uranium-238, which also happens to undergo fission when struck by the neutrons produced by D-T fusion. This casing, called the pusher, thus has three jobs: to keep the secondary cool, to hold it, inertially, in a highly compressed state, and, finally, to serve as the chief energy source for the entire bomb. The consumable pusher makes the bomb more a uranium fission bomb than a hydrogen fusion bomb. It is noteworthy that insiders never used the term hydrogen bomb. * Finally, the heat for fusion ignition comes not from the primary but from a second fission bomb called the spark plug, embedded in the heart of the secondary. The implosion of the secondary implodes this spark plug, detonating it and igniting fusion in the material around it, but the spark plug then continues to fission in the neutron-rich environment until it is fully consumed, adding significantly to the yield. The initial impetus behind the two-stage weapon was President Truman’s 1950 promise to build a 10-megaton hydrogen superbomb as the U.S. response to the 1949 test of the first Soviet fission bomb. But the resulting invention turned out to be the cheapest and most compact way to build small nuclear bombs as well as large ones, erasing any meaningful distinction between A-bombs and H-bombs, and between boosters and supers. All the best techniques for fission and fusion explosions are incorporated into one all-encompassing, fully-scalable design principle. Even six-inch (152 mm) diameter nuclear artillery shells can be two-stage thermonuclears. In the ensuing fifty years, nobody has come up with a better way to build a nuclear bomb. It is the design of choice for the United States, Russia, the United Kingdom, China, and France, the five thermonuclear powers. |
Nuclear fallout – from Wikipedia
|
Fallout is the residual radiation hazard from a nuclear explosion, so called because it “falls out” of the atmosphere after the explosion. It commonly refers to the radioactive dust created when a nuclear weapon explodes. This radioactive dust, consisting of hot particles, is a kind of radioactive contamination. It can lead to the contamination of ground and the animal food chain. [..] Local In a land or water surface burst, heat vaporizes large amounts of earth or water, which is drawn up into the radioactive cloud. This material becomes radioactive when it condenses with fission products and other radiocontaminants that have become neutron-activated. Most of the isotopes in the table below mostly decay into the isotopes that many people are more familiar with. Some radiation would taint large amounts of land and drinking water causing formal mutations throughout animal and human life. Per capita thyroid doses in the continental United States resulting from all exposure routes from all atmospheric nuclear tests conducted at the Nevada Test Site from 1951-1962. Table (according to T. Imanaka et al.) of the relative abilities of isotopes to form solids
A surface burst generates large amounts of particulate matter, composed of particles from less than 100 nm to several millimeters in diameter—in addition to very fine particles that contribute to worldwide fallout. The larger particles spill out of the stem and cascade down the outside of the fireball in a downdraft even as the cloud rises, so fallout begins to arrive near ground zero within an hour. More than half the total bomb debris lands on theground within about 24 hours as local fallout. Chemical properties of the elements in the fallout control the rate at which they are deposited on the ground. Less volatile elements deposit first. Severe local fallout contamination can extend far beyond the blast and thermal effects, particularly in the case of high yield surface detonations. The ground track of fallout from an explosion depends on the weather situation from the time of detonation onwards. In stronger winds, fallout travels faster but takes the same time to descend, so although it covers a larger path, it is more spread out or diluted. So the width of the fallout pattern for any given dose rate is reduced where the downwind distance is increased by higher winds. The total amount of activity deposited up to any given time is the same irrespective of the wind pattern, so overall casualty figures from fallout are generally independent of winds. But thunderstorms can bring down activity as rain more rapidly than dry fallout, particularly if the mushroom cloud is low enough to be below (“washout”), or mixed with (“rainout”), the thunderstorm. Whenever individuals remain in a radiologically contaminated area, such contamination leads to an immediate external radiation exposure as well as a possible later internal hazard from inhalation and ingestion of radiocontaminants, such as the rather short-lived iodine-131, which is accumulated in the thyroid. |
Isotopic signature – from Wikipedia
|
Radioactive isotopes Hot particles, radioactive particles of nuclear fallout and radioactive waste, also exhibit distinct isotopic signatures. Their radionuclide composition (and thus their age and origin) can be determined by mass spectrometry or by gamma spectrometry. For example, particles generated by a nuclear blast contain detectable amounts of 60Co and 152Eu. The Chernobyl accident did not release these particles but did release 125Sb and 144Ce. Particles from underwater bursts will consist mostly of irradiated sea salts. Ratios of 152Eu/155Eu, 154Eu/155Eu, and 238Pu/239Pu are also different for fusion and fission nuclear weapons, which allows identification of hot particles of unknown origin. |
_________________________________________________________________
Radioactive decay

IMAGE: http://sol.sci.uop.edu/~jfalward/nuclearreactions/nuclearreactions.html

IMAG: http://sol.sci.uop.edu/~jfalward/nuclearreactions/nuclearreactions.html
Radiation spikes detected in WTC dust samplesCharacterization of the Dust/Smoke Aerosol that Settled East of the World Trade Center (WTC) in Lower Manhattan after the Collapse of the WTC 11 September 2001 Radionuclides. We analyzed the gamma spectrum of the samples using an EG&G/Ortec high-purity Ge detector (50% relative efficiency) gamma counter (EG&G/Ortec Instruments, Inc., Oak Ridge, TN). We analyzed approximately 50 peaks based on statistical significance (counting/lack of interferences). These included thorium, uranium, actinium series, and primordial radionuclides. Liquid scintillation analyses were conducted for emissions on the total dust and smoke samples using a Packard Tri-Carb Model 2770 TR/SL (Packard Instrument, Meriden, CT). The MDA for alpha radioactivity was 0.30 DPM (0.14 pCi) based on a NIST-traceable 226Ra standard (National Institute of Standards and Technology, Gaithersburg, MD). When placed in the liquid scintillation fluid, the WTC samples are somewhat darker than the backgrounds and calibration standard, which may cause slight underreporting of the beta activity due to quenching and standard-to-sample efficiency bias. http://www.ehponline.org/members/2002/110p703-714lioy/lioy-full.html |
Barium, Strontium and Uranium found in elevated levels in WTC dust

IMAGE: http://www.ehponline.org/members/2002/110p703-714lioy/lioy-full.html
Radioactive Byproducts of Depleted Uranium (Uranium-238)
IMAGE: http://www.ccnr.org/decay_U238.html
Leachate analyzed

IMAGE: http://pubs.usgs.gov/of/2001/ofr-01-0429/leach1 (highlighting added)
Chemical analysis of WTC dust and girder coating

IMAGE: http://pubs.usgs.gov/of/2001/ofr-01-0429/chem1/index.html (Highlighting added)
Uranium-238 Decay Series
| Nuclide |
Half-Life | Radiation * |
|---|---|---|
| U-238 | 4.468 · 109 years | alpha |
| Th-234 | 24.1 days | beta |
| Pa-234m | 1.17 minutes | beta |
| U-234 | 244,500 years | alpha |
| Th-230 | 77,000 years | alpha |
| Ra-226 | 1,600 years | alpha |
| Rn-222 | 3.8235 days | alpha |
| Po-218 | 3.05 minutes | alpha |
| Pb-214 | 26.8 minutes | beta |
| Bi-214 | 19.9 minutes | beta |
| Po-214 | 63.7 microseconds | alpha |
| Pb-210 | 22.26 years | beta |
| Bi-210 | 5.013 days | beta |
| Po-210 | 138.378 days | alpha |
| Pb-206 | stable | – |
only major decays shown
* in addition, all decays emit gamma radiation
TABLE: http://www.wise-uranium.org/rup.html
Uranium-235 Decay Series
| Nuclide |
Half-Life | Radiation * |
|---|---|---|
| U-235 | 703.8 · 106 years | alpha |
| Th-231 | 25.52 hours | beta |
| Pa-231 | 32,760 years | alpha |
| Ac-227 | 21.773 years | beta |
| Th-227 | 18.718 days | alpha |
| Ra-223 | 11.434 days | alpha |
| Rn-219 | 3.96 seconds | alpha |
| Po-215 | 778 microseconds | alpha |
| Pb-211 | 36.1 minutes | beta |
| Bi-211 | 2.13 minutes | alpha |
| Tl-207 | 4.77 minutes | beta |
| Pb-207 | stable | – |
only major decays shown
* in addition, all decays emit gamma radiation
TABLE: http://www.wise-uranium.org/rup.html
Some of the Radioactive Poisons in Spent Nuclear Fuel
| NAME | Niobium-94 | Rhenium-187 | Thorium-232 |
| Hydrogen-3 (tritium) | Molybdenum-93 | Lead-205 | Thorium-234 |
| Beryllium-10 | Technetium-99 | Lead-210 | Protactinium-231 |
| Carbon-14 | Ruthenium-106 | Bismuth-208 | Protactinium-233 |
| Silicon-32 | Palladium-107 | Bismuth-210 | Protactinium-234 |
| Phosphorus-32 | Cadmium-113m | Bismuth-210m | Uranium-232 |
| Potassium-40 | Tin-126 | Polonium-210 | Uranium-233 |
| Calcium-42 | Antimony-125 | Radon-222 | Uranium-234 |
| Iron-55 | Antimony-126 | Radon-223 | Uranium-235 |
| Cobalt-60 | Tellurium-125m | Radium-224 | Uranium-236 |
| Nickel-59 | Iodine-129 | Radium-225 | Uranium-238 |
| Nickel-63 | Cesium-134 | Radium-226 | Neptunium-237 |
| Selenium-79 | Cesium-135 | Radium-228 | Plutonium-238 |
| Krypton-81 | Cesium-137 | Actinium-225 | Plutonium-239 |
| Krypton-83 | Cerium-144 | Actinium-227 | Plutonium-240 |
| Rubidium-87 | Promethium-147 | Thorium-227 | Plutonium-241 |
| Strontium-90 | Europium-154 | Thorium-228 | Plutonium-242 |
| Yttrium-90 | Europium-155 | Thorium-229 | Americium-241 |
| Zirconium-93 | Hafnium-182 | Thorium-230 | Americium-242m |
| Niobium-93 | Tantalum-182 | Thorium-231 | Curium-244 |
TABLE: http://www.ccnr.org/poisons.html
Decay products cross-referenced with WTC leachate
| NAME | Niobium-94 | Rhenium-187 | Thorium-232 |
| Hydrogen-3 (tritium) | Molybdenum-93 | Lead-205 | Thorium-234 |
| Beryllium-10 | Technetium-99 | Lead-210 | Protactinium-231 |
| Carbon-14 | Ruthenium-106 | Bismuth-208 | Protactinium-233 |
| Silicon-32 | Palladium-107 | Bismuth-210 | Protactinium-234 |
| Phosphorus-32 | Cadmium-113m | Bismuth-210m | Uranium-232 |
| Potassium-40 | Tin-126 | Polonium-210 | Uranium-233 |
| Calcium-42 | Antimony-125 | Radon-222 | Uranium-234 |
| Iron-55 | Antimony-126 | Radon-223 | Uranium-235 |
| Cobalt-60 | Tellurium-125m | Radium-224 | Uranium-236 |
| Nickel-59 | Iodine-129 | Radium-225 | Uranium-238 |
| Nickel-63 | Cesium-134 | Radium-226 | Neptunium-237 |
| Selenium-79 | Cesium-135 | Radium-228 | Plutonium-238 |
| Krypton-81 | Cesium-137 | Actinium-225 | Plutonium-239 |
| Krypton-83 | Cerium-144 | Actinium-227 | Plutonium-240 |
| Rubidium-87 | Promethium-147 | Thorium-227 | Plutonium-241 |
| Strontium-90 | Europium-154 | Thorium-228 | Plutonium-242 |
| Yttrium-90 | Europium-155 | Thorium-229 | Americium-241 |
| Zirconium-93 | Hafnium-182 | Thorium-230 | Americium-242m |
| Niobium-93 | Tantalum-182 | Thorium-231 | Curium-244 |
TABLE: Cross-referenced with the elements in the leachate table
FROM: http://www.ccnr.org/poisons.html
Decay products of spent nuclear fuel cross-referenced with WTC dust and girder coating chemicals
| NAME | Niobium-94 | Rhenium-187 | Thorium-232 |
| Hydrogen-3 (tritium) | Molybdenum-93 | Lead-205 | Thorium-234 |
| Beryllium-10 | Technetium-99 | Lead-210 | Protactinium-231 |
| Carbon-14 | Ruthenium-106 | Bismuth-208 | Protactinium-233 |
| Silicon-32 | Palladium-107 | Bismuth-210 | Protactinium-234 |
| Phosphorus-32 | Cadmium-113m | Bismuth-210m | Uranium-232 |
| Potassium-40 | Tin-126 | Polonium-210 | Uranium-233 |
| Calcium-42 | Antimony-125 | Radon-222 | Uranium-234 |
| Iron-55 | Antimony-126 | Radon-223 | Uranium-235 |
| Cobalt-60 | Tellurium-125m | Radium-224 | Uranium-236 |
| Nickel-59 | Iodine-129 | Radium-225 | Uranium-238 |
| Nickel-63 | Cesium-134 | Radium-226 | Neptunium-237 |
| Selenium-79 | Cesium-135 | Radium-228 | Plutonium-238 |
| Krypton-81 | Cesium-137 | Actinium-225 | Plutonium-239 |
| Krypton-83 | Cerium-144 | Actinium-227 | Plutonium-24 |
| Rubidium-87 | Promethium-147 | Thorium-227 | Plutonium-241 |
| Strontium-90 | Europium-154 | Thorium-228 | Plutonium-242 |
| Yttrium-90 | Europium-155 | Thorium-229 | Americium-241 |
| Zirconium-93 | Hafnium-182 | Thorium-230 | Americium-242m |
| Niobium-93 | Tantalum-182 | Thorium-231 | Curium-244 |
Radium – radon was detected in the Fresh Kills Landfill where the WTC debris was deposited.
Some of the Radioactive Poisons in Spent Nuclear Fuel
| NAME | Niobium-94* | Rhenium-187 | Thorium-232* |
| Hydrogen-3 (tritium) | Molybdenum-93* | Lead-205* | Thorium-234* |
| Beryllium-10* | Technetium-99 | Lead-210* | Protactinium-231 |
| Carbon-14 | Ruthenium-106 | Bismuth-208* | Protactinium-233 |
| Silicon-32 | Palladium-107 | Bismuth-210* | Protactinium-234 |
| Phosphorus-32 | Cadmium-113m* | Bismuth-210m* | Uranium-232* |
| Potassium-40 | Tin-126 | Polonium-210 | Uranium-233* |
| Calcium-42* | Antimony-125* | Radon-222 | Uranium-234* |
| Iron-55* | Antimony-126* | Radon-223 | Uranium-235* |
| Cobalt-60* | Tellurium-125m | Radium-224 | Uranium-236* |
| Nickel-59* | Iodine-129 | Radium-225 | Uranium-238* |
| Nickel-63* | Cesium-134* | Radium-226 | Neptunium-237 |
| Selenium-79 | Cesium-135* | Radium-228 | Plutonium-238 |
| Krypton-81 | Cesium-137* | Actinium-225 | Plutonium-239 |
| Krypton-83 | Cerium-144* | Actinium-227 | Plutonium-240 |
| Rubidium-87* | Promethium-147 | Thorium-227* | Plutonium-241 |
| Strontium-90* | Europium-154 | Thorium-228* | Plutonium-242 |
| Yttrium-90* | Europium-155 | Thorium-229* | Americium-241 |
| Zirconium-93 | Hafnium-182 | Thorium-230* | Americium-242m |
| Niobium-93* | Tantalum-182 | Thorium-231* | Curium-244 |

FROM: http://www.atral.com/U2381.html

FROM: http://en.wikipedia.org/wiki/Image:Radioactive_decay_chains_diagram.svg

FROM: http://www.wise-uranium.org/rup.html

Caption: An atom of uranium-238 when struck by a neutron becomes an atom of uranium-239 which decays into neptunium-239 by giving off a beta particle which decays into plutonium-239 by giving off another beta particle.

Caption: When a neutron strikes a non-fissile atom of uranium-238 two beta particles are given off and the result is a fissile plutonium atom. FROM: http://www.ccnr.org/breeding_ana.html


Caption: When a neutron strikes a fissile uranium atom of U-235 the results are fission products and more neutrons. FROM: http://www.ccnr.org/fission_ana.html
Uranium-235 Decay Series

Img: http://www.downtheyellowcakeroad.org/userfiles/image/Uranium_235_DChn_TBL_608x761.png URL: http://www.downtheyellowcakeroad.org/html/sciencebasics.html Caption: Beginning with naturally occurring uranium-235, this series includes the following elements: Actinium, astatine, bismuth, francium, lead, polonium, protactinium, radium, radon, thallium, and thorium. All are present, at least transiently, in any uranium-containing sample, whether metal, compound, ore, or mineral.
Executive Summary: Environmental Studies of the World Trade Center area after the September 11, 2001 attack
|
Version 1.1 Published November 27, 2001 Roger N. Clark1, Robert O. Green2, Gregg A. Swayze1, Greg Meeker1, Steve Sutley1, Todd M. Hoefen1, K. Eric Livo1, Geoff Plumlee1, Betina Pavri2, Chuck Sarture2, Steve Wilson1, Phil Hageman1, Paul Lamothe1, J. Sam Vance3, Joe Boardman4 Isabelle Brownfield1, Carol Gent1, Laurie C. Morath1, Joseph Taggart1, Peter M. Theodorakos1, and Monique Adams1 This web site describes the results of an interdisciplinary environmental characterization of the World Trade Center (WTC) area after September 11, 2001. Information presented in this site was first made available to the World Trade Center emergency response teams on September 18, 2001 (Thermal hot spot information), and September 27, 2001 (maps and compositional results). The Airborne Visible / Infrared Imaging Spectrometer (AVIRIS), a hyperspectral remote sensing instrument, was flown by JPL/NASA over the World Trade Center (WTC) area on September 16, 18, 22, and 23, 2001 ( Link to the AVIRIS JPL data facility). A 2-person USGS crew collected samples of dusts and airfall debris from more than 35 localities within a 1-km radius of the World trade Center site on the evenings of September 17 and 18, 2001. Two samples were collected of indoor locations that were presumably not affected by rainfall (there was a rainstorm on September 14). Two samples of material coating a steel beam in the WTC debris were also collected. [..] Results of these studies to date lead to several important conclusions:* The dusts released from the WTC building collapse are largely composed of particles of glass fibers, gypsum, concrete, paper, and other miscellaneous materials commonly used in building construction. * Laboratory analyses (RS, SEM, XRD) have detected chrysotile asbestos only in trace levels (less than 1 weight percent) in over two thirds of the dust and airfall debris samples. To date, no amphibole asbestos minerals have been detected in any of the dust samples. [..] * Laboratory analyses of the material coating a steel beam in the WTC debris have detected the presence of chrysotile asbestos (a serpentine mineral) at levels as high as 20% (by volume) of the coating material. No amphibole asbestos has been detected in this beam coating material. * AVIRIS mineral maps do not show widespread distribution of chrysotile or amphibole asbestos at the few-percent detection limit of the instrument at the ground surface. [..] * AVIRIS mineral maps show a few isolated pixels of amphibole minerals, but these pixels are isolated with no clusters like those seen in the chrysotile pixels. The few mapped amphibole pixels are at a statistical noise level in the WTC area similar to the pixel noise level mapped throughout the city. [..] * Laboratory analyses and the AVIRIS mapping results indicate the dusts are variable in composition, both on a fine scale within individual samples and on a coarser spatial scale based on direction and distance from the WTC. Replicate mineralogical and chemical analyses of material from the same sample reveal variability that presumably is due to the heterogeneous mixture of different materials comprising the dusts. The spatial variability is observed at large scales of tens of meters to centimeter and smaller scales. AVIRIS mapping suggests that materials with higher iron content settled to the south-southeast of the building 2 collapse center. Chrysotile may occur primarily (but not exclusively) in a discontinous pattern radially in west, north, and easterly directions perhaps at distances greater than 3/4 kilometer from ground zero. * Although only trace levels of chrysotile asbestos have been detected in the dust and airfall samples studied to date, the presence of up to 20 volume % chrysotile in material coating steel beams in the WTC debris, and the potential areas indicated in the AVIRIS mineral maps indicates that asbestos can be found in localized concentrations. * Chemical leach tests of the dusts and airfall debris samples indicate that the dusts can be quite alkaline. When reacted with rain water or wash water from cleanup efforts, the dusts can produce slightly alkaline to very alkaline solutions, due to partial dissolution of concrete, gypsum, and glass fiber particles. Indoor dust samples generated the highest pH levels (11.8) in the leach tests, indicating that dusts that have not been exposed to rainfall since September 11th are substantially more alkaline than those that have been leached by rainfall. * At least some heavy metals and metalloids (such as aluminum, chromium, antimony, molybdenum, and barium) are readily leached from the dusts into rain or wash water. Indoor dust samples showed greater proportions of leachable metals than outdoor dust samples. These metals may also be potentially bioavailable if the dusts are accidentally inhaled or ingested. Chemical leach tests of the material coating steel girders in the WTC debris indicate that the coatings can contain soluble chromium. * AVIRIS data collected on September 16, 2001, revealed a number of thermal hot spots in the region where the WTC buildings collapsed. Analysis of the data indicated temperatures greater than 800oF in these hot spots (some over 1300oF) . Over 3 dozen hot spots of varying size and temperature were present in the core zone of the WTC. By September 23, most of these fires that were observable from an aircraft had been eliminated or reduced in intensity. * Our finding that trace levels of asbestos are present in the dust samples is consistent with results of other studies carried out by the U.S.Environmental Protection Agency (www.epa.gov). Our results provide further clarification by showing that 1) elevated concentrations of asbestos may be present in beam coatings and possible localized area as indicated by the AVIRIS maps, and 2) asbestos in the dusts and beam coating materials is composed only of chrysotile asbestos and does not contain amphibole asbestos. [..] |
Comments on the Executive Summary:
• Asbestos was not found in any medically significant amounts
• There was a rainstorm on the 14th of September, three days after the 9/11 event.
• There is a difference in the dust found indoors and outdoors. Much of the incriminating evidence outside was washed away with washing program and the rainstorm on 14th of September.
• Barium was found.
• Sizes of particles peaked at 0.3 to 3 microns.
• This report and the investigation focuses on asbestos. There is little evidence to show they did studies to investigate a possible radiological cause of the event such as a nuclear weapon.
USGS: Determination of a Diagnostic Signature for World Trade Center Dust using Scanning Electron Microscopy Point Counting Techniques
|
By Gregory P. Meeker, Amy M. Bern*, Heather A. Lowers, and Isabelle K. Brownfield. Open-File Report 2005 – 1031 U.S. Department of the Interior U.S. Geological Survey, Denver Federal Center, Denver, CO 80225 Sample Preparation Samples were collected from outdoor and indoor locations at various distances from the WTC site. Samples USGS 4, 6, and 12 were collected from ground level between September 16 – 17, 2001, at distances of 0.80, 0.60, and 0.55 km, respectively, from the center of the WTC site. These samples were wetted by one rain storm prior to collection. Sample USGS 36, collected on September 12, 2001, was obtained inside an apartment on the 30th floor of a building 2 blocks (0.40 km) from the WTC site. Details of sample collection procedures and locations for the above samples are given in Clark and others (2001) and Swayze and others (2005). Sample LM2 is an outdoor sample collected on September 16 – 17, 2001, approximately 0.70 km east of the WTC site. Sample L18-2 was collected indoors on November 19, 2001, from an area adjacent to the WTC site (0.25 km west). Results Component analysis for the six WTC bulk samples is summarized in Table 1 and Figures 2 – 7. All of the samples show three primary components – gypsum, phases compatible with concrete, and MMVF. The additional particle types shown in Table 1 were found in most samples. The data demonstrate that the most consistent particle-type abundance ratios occur within the MMVF, i.e., slag wool, rock wool, and soda-lime glass. In all samples, slag wool is the dominant MMVF component while rock wool and soda-lime glass fibers occur in all samples at similar relative abundances below approximately 10 to less than 1 percent total MMVF (Table 1). One exception to this observation was identified in a single field counted at 100 times magnification on sample L18-2. In this field, a single large soda-lime glass fiber and a single large rock wool fiber were found; these two fibers significantly affected MMVF relative particle abundances. If these two fibers are not included, the relative MMVF abundances for this sample are similar to those for the other samples. A second field on this sample was counted at 100 times magnification; the resulting data were consistent with the other samples (Table 2). In all samples, the relative abundances of rock wool and soda-lime glass fibers are based on a small number of fibers; thus, the statistical significance of reported proportions of these fiber types is correspondingly low.
http://pubs.usgs.gov/of/2005/1031/pdf/OF2005_1031_508.pdf USGS report Determination of a Diagnostic Signature for World Trade Center Dust using Scanning Electron Microscopy Point Counting Techniques By Gregory P. Meeker, Amy M. Bern, Heather A. Lowers, and Isabelle K. Brownfield All samples also contain gypsum and concrete phases. In the outdoor samples, these components, along with total MMVF, vary in relative abundance. This variation is likely related to samples having been exposed to moisture and precipitation, which caused varying amounts of gypsum dissolution prior to sample collection. The two indoor samples, unaffected by precipitation, have much less variable compositions. By far, the most abundant nonfibrous particles in all samples are gypsum and concrete. Particle size distributions for these components (Figs. 8 and 9) suggest relationships to distance and elevation. Percent frequency is compared to area and maximum diameter, as measured on the SEM. The majority of these nonfibrous particles in each sample have similar particle area distributions with the majority of particles in the range from 0.3 to 3 μm. Sample L18-2, collected adjacent to the WTC site, is characterized by a somewhat higher concentration of particles in the 3 to 300 μm2 size range. Particles in samples USGS 4 and 6 fall at slightly higher values of total area, between 1 and 300 μm2, than in the other outdoor samples. The effect of particle-size distribution as a function of distance is most clearly seen in Figure 9 where samples L18-2 and USGS 36 clearly deviate from the other samples with respect to size distribution. Sample L18-2, the closest sample to the WTC site, shows a higher abundance of larger diameter particles. Sample USGS 36, collected on the 30th floor of a building, shows a higher abundance of smaller diameter particles. MMVF diameters for all samples combined are given in Table 3. The distributions of MMVF diameters display no clear relationship to distance from the WTC site.
Img: http://pubs.usgs.gov/of/2005/1031/pdf/OF2005_1031_508.pdf USGS report Determination of a Diagnostic Signature for World Trade Center Dust using Scanning Electron Microscopy Point Counting Techniques By Gregory P. Meeker, Amy M. Bern, Heather A. Lowers, and Isabelle K. Brownfield
Img: http://pubs.usgs.gov/of/2005/1031/pdf/OF2005_1031_508.pdf USGS report Determination of a Diagnostic Signature for World Trade Center Dust using Scanning Electron Microscopy Point Counting Techniques By Gregory P. Meeker, Amy M. Bern, Heather A. Lowers, and Isabelle K. Brownfield Conclusions Six bulk WTC dust samples, collected from locations in different directions, elevations, and from outdoor and indoor environments show relatively consistent abundance ratios of major and minor components. For the purposes of identification of WTC dust, these abundance ratios appear to be within the necessary limits of variability. Furthermore, the critical dust components can be identified easily and quickly using routine SEM and x-ray microanalysis techniques. Data presented here suggest that the presence and relative abundance of the three MMVF components – slag wool, rock wool, and soda-lime glass – along with the presence of concrete particles and gypsum could be used as a primary diagnostic signature for WTC dust. Secondary signature components could include FeOx, ZnOx, silica, and chrysotile. http://pubs.usgs.gov/of/2005/1031/pdf/OF2005_1031_508.pdf USGS report |


Determination of a Diagnostic Signature for World Trade Center Dust using Scanning Electron Microscopy Point Counting Techniques
By Gregory P. Meeker, Amy M. Bern, Heather A. Lowers, and Isabelle K. Brownfield
Open-File Report 2005 – 1031
|
USGS: Particle Atlas of World Trade Center Dust By Heather A. Lowers and Gregory P. Meeker U.S. Department of the Interior U.S. Geological Survey Introduction The United States Environmental Protection Agency (EPA) has begun a reassessment of the presence of World Trade Center (WTC) dust in residences, public buildings, and office spaces in New York City, New York. Meeker and others (2005a) have identified slag wool (a man-made vitreous fiber, MMVF), gypsum (CaSO4_2H2O) (or anhydrite (CaSO4)), and phases compatible with concrete as signature components of the WTC dust. In addition to these phases, other MMVF, metal or metal oxides, mineral material, and asbestos are present in trace to minor amounts. Background dust samples collected from residences, public buildings, and office spaces will be analyzed by multiple laboratories for the presence of WTC dust. Other laboratories are currently studying WTC dust for other purposes, such as health effects studies. To assist in inter-laboratory consistency for identification of WTC dust components, this particle atlas of phases in WTC dust has been compiled. This particle atlas contains energy dispersive x-ray spectra (EDS) of the common phases found in WTC dust. In addition, scanning electron photomicrographs showing typical morphology of selected particles are included. The dust is a product of the collapse of WTC buildings and contents. While the list of spectra provided is comprehensive, it is by no means complete. Therefore, it is likely phases and compounds will be identified in the future that are not listed in this atlas. It is recognized that different laboratories will have different equipment, analytical conditions, and capabilities which may result in differences in the energy dispersive x-ray spectrum for a given phase. Particle size and shape can also affect relative x-ray peak heights. In order to facilitate inter-laboratory comparison, energy dispersive x-ray spectra at three different accelerating voltages (10, 15, and 20 keV) of a basalt glass standard (BIR-1G) acquired on a polished mount are included (Meeker and others, 1998). These spectra will allow laboratory personnel to evaluate possible differences between the spectra included in this report and spectra from similar phases obtained in their own laboratory. Samples of BIR-1G are available from the U.S. Geological Survey1. Methods A JEOL JSM-5800LV scanning electron microscope (SEM) equipped with an Oxford ISIS energy dispersive spectrometry system was used to acquire the spectra. A silicon detector with resolution better than 133 eV full width half maximum (FWHM) for Mn was used. The display resolution was set to 10 eV per channel. The operating conditions for the dust were 15 keV, approximately 0.1 nA beam current (cup), 100 second acquisition time (livetime), with 20-30% detector deadtime. Typical spectra range from 10 to 20 thousand counts full scale. The samples were analyzed at a 10 millimeter working distance (instrument specific) with zero degree tilt. The samples were mounted on carbon conductive tabs and coated with carbon for conductivity. Results The collected spectra in Table 1 are categorized into MMVF and glass fragments, gypsum/anhydrite, phases compatible with concrete, asbestos, metal or metal oxides, and mineral material groups (discussed below). To view the spectrum for each phase, click on the particle label. An image of the spectrum will appear in a new window. A column labeled “image” will open a photomicrograph of selected particles from which spectra were collected. A list of elements detected in each spectrum is also given which allows the user to search by element for an unidentified particle. All spectra contain a peak for carbon because of the conductive carbon coat. This has been omitted from the table unless is it reasonable for carbon to be in the particle as in the case of calcite (CaCO3), dolomite (CaMg(CO3)2), or organic matter. The carbon peak for the concrete phases has been labeled although its presence is questionable. It is not possible to distinguish between calcite (CaCO3), Portlandite (Ca(OH)2), and lime (CaO) using a detector that does not allow for detection of light elements, such as carbon and oxygen. Gypsum/anhydrite Gypsum (CaSO4_2H2O) and anhydrite (CaSO4), along with a variety of other hydrated Ca sulfates are the primary components of wall board (drywall). Other minor and trace components of drywall such as quartz (SiO2), barite (BaSO4), and calcite (CaCO3) are included with mineral material below. Gypsum and anhydrite are indistinguishable using qualitative EDS methods. The spectrum for each is dominated by Ca and S. The peak height ratios of these two elements will vary depending on particle geometry, orientation to the detector, and other adjacent or adhering phases. For instance, Gypsum-01 is a typical spectrum for gypsum whereas Gypsum-03 occurs with a small amount of carbonate which increases the Ca and C peaks relative to S. MMVF and glass fragments Man-made vitreous fibers (MMVF) are abundant in WTC dust. Glass fibers range in diameter from 50 μm with lengths up to several hundred micrometers. The best compositional match for the majority (>85%) of WTC glass fibers is slag wool, a by-product of pig iron production (TIMA, 1991). Pieces of yellow thermal insulation found in bulk samples are composed of soda-lime glass fibers (Meeker and others, 2005b). Very few fibers of this composition exist in the fine ( Rock wool and slag wool can have similar EDS spectra. The two can be distinguished based on the presence of iron. Slag wool will generally have less than 2 weight percent FeO whereas rock wool contains from 3 to 12 weight percent FeO (TIMA, 1991). Soda-lime glass has a distinct EDS spectrum from both slag wool and rock wool. The Na peak is higher and Ca, Mg, and Al peaks are smaller in the soda-lime glass spectrum than the slag wool and rock wool spectra. Glass shards, fragments, and spheres are also present in the dust samples. The microscopic glass shards and fragments are less abundant than the ubiquitous slag wool fibers in the fine dust ( 90%) of glass spheres, generally less than 500 μm in diameter, are of slag wool composition. Concrete Concrete is composed of aggregate, sand, and Portland cement (Chandra and Berntsson, 2003). The aggregate material in WTC concrete sample appears to be expanded shale. The sand is primarily quartz, but can contain feldspar, iron and titanium oxides, micas, and other rock-forming minerals. Portlandite (Ca(OH)2) and magnesium hydroxide are also present in minor to trace amounts. Portland cement hydrates to form a large variety of Ca-rich phases including calcium silicate hydrate, calcium aluminum hydrate, calcium aluminum iron hydrate, and Portlandite (Ca(OH)2) (Chandra and Berntsson, 2003). Portlandite is indistinguishable from lime (CaO) using qualitative EDS. Minor gypsum is added to control the set of the concrete. Particles identifiable as concrete in WTC dust are those constituting the Portland cement component. Portland cement particles will usually have a high Ca peak accompanied by Si and/or Al, Mg, Fe. Most particles of Portland cement will be composed of several Ca-rich phases. These phases are generally extremely fine grained and often occur without distinct grain boundaries. These phases can usually be differentiated using backscattered electron imaging combined with EDS analysis. A large proportion of the quartz in WTC dust is likely from disaggregated concrete, but has been grouped below with mineral material. Calcite (CaCO3) and dolomite (CaMg(CO3)2) are also components of concrete, but as with quartz, have been grouped with mineral material because they can be present from a variety of sources. Asbestos Chrysotile (Mg3Si2O5(OH)4) is present in most bulk WTC samples at levels of approximately 0.1 to 1.0 wt. percent (Meeker and others, 2005a,b; Clark and others, 2001). Chatfield and others (2002) observed amosite ((Mg,Fe)7Si8O22(OH)2) and richterite (Na(CaNa)Mg5Si8O22(OH)2) or winchite ((CaNa)Mg4(Al,Fe3+)Si8O22(OH)2) fibers in one sample collected north of the WTC site. Spectra of richterite/winchite and amosite have been included in this data set for completeness. Chrysotile (Mg3Si2O5(OH)4) can be differentiated from talc (Mg3Si4O10(OH)2) based on the relative peak heights of Mg and Si. The Mg peak is higher than the Si peak in the chrysotile spectrum but lower than the Si in the talc spectrum. Metal and Metal-Oxide Phases The primary metal and metal-oxide phases in WTC dust are Fe-rich and Zn-rich particles (Meeker and others, 2005b). Many other metal and metal oxide phases have been identified including phases rich in Al, Ti, Pb, Bi, Mo, Zr, Sn, Cu, and others. It is often difficult to distinguish between metals and metal oxides with qualitative EDS because of adsorbed surface oxygen or thin coatings of oxide phases such as rust. It is impossible to distinguish metals and metal-oxides with qualitative EDS analysis using a Be window x-ray detector. In order to distinguish Mo-, Pb-, and Bi- rich phases it is necessary to look for additional M, L, and K series peaks. This may require higher accelerating voltages to excite these x-ray energies. If additional M, L, or K series peaks are not observed, these elements are probably not present and the peak occurring near ~2.3 keV can be attributed primarily to S. Mineral material Mineral material includes all particles that generally occur as rock-forming minerals. The primary components in this group include quartz (SiO2), feldspars ((Ca,Na,K)1(Si,Al)4O8), micas (including vermiculite), talc (Mg3Si4O10(OH)2), calcite (CaCO3), dolomite (CaMg(CO3)2), sulfide minerals, barite (BaSO4), and others. Quartz is distinguished from other Si-rich phases, such as glass shards, based on the absence of other trace to minor elements such as Na, K, and Al. Compare Si-03 and Si-01, respectively. Summary This particle atlas has been compiled to serve as a guide to identify common phases in WTC dust. It is not a complete guide to all phases that may be found in WTC dust. The particles have been identified by stoichiometric criteria using data acquired by SEM and x-ray microanalysis. Identification is based on extensive experience gained by previous research on WTC dust using electron probe microanalysis, x-ray diffraction, infrared spectroscopy, and other techniques (Meeker and others, 2005a; Meeker and others, 2005b; Lowers and others, 2005; Clark and others, 2001). |
USGS: Particle Atlas of World Trade Center Dust

TABLE: http://pubs.usgs.gov/of/2005/1165/table_1.html
COMMENT: Presence of strontium, zirconium, molybendum, cadmium, bismuth.
Images from the table above

IMG: http://pubs.usgs.gov/of/2005/1165/graphics/GYPSUM-01-IMAGE.jpg URL: http://pubs.usgs.gov/of/2005/1165/table_1.html Caption: gypsum-01 Caption: Gypsum-1

IMG: http://pubs.usgs.gov/of/2005/1165/graphics/CONCRETE-03-IMAGE.jpg URL: http://pubs.usgs.gov/of/2005/1165/table_1.html Caption: Concrete-03

IMG: http://pubs.usgs.gov/of/2005/1165/graphics/CONCRETE-05-IMAGE.jpg URL: http://pubs.usgs.gov/of/2005/1165/table_1.html Caption: Concrete-05

IMG: http://pubs.usgs.gov/of/2005/1165/graphics/CONCRETE-05-IMAGE.jpg URL: http://pubs.usgs.gov/of/2005/1165/table_1.html Caption: Concrete-05 Backscattered electron image.

IMG: http://pubs.usgs.gov/of/2005/1165/graphics/CONCRETE-06-IMAGE.jpg URL: http://pubs.usgs.gov/of/2005/1165/table_1.html Caption: Concrete-06

IMG: http://pubs.usgs.gov/of/2005/1165/graphics/IRON-02-IMAGE.jpg URL: http://pubs.usgs.gov/of/2005/1165/table_1.html Caption: Iron-02

IMG: http://pubs.usgs.gov/of/2005/1165/graphics/IRON-03-IMAGE.jpg URL: http://pubs.usgs.gov/of/2005/1165/table_1.html Caption: Iron-03

IMG: http://pubs.usgs.gov/of/2005/1165/graphics/IRON-04-IMAGE.jpg URL: http://pubs.usgs.gov/of/2005/1165/table_1.html Caption: Iron-04
Electron Microscopy and Energy Dispersive X-Ray Analysis
|
Selected WTC dust samples were analyzed by scanning electron microscopy (SEM) and energy dispersive x-ray microanalysis (EDS) at the USGS Denver Microbeam Laboratory (exit to the Denver Microbeam Laboratory web site by clicking here). The primary purpose of the SEM/EDS analysis was to determine if the WTC dust contained asbestos. Electron microscopy was used because extremely low levels of asbestos fibers can be detected and chemically analyzed. Representative portions of samples wtc01-3, wtc01-8, wtc01-14, wtc01-15, wtc01-16, wtc01-20, wtc01-22, wtc01-25, wtc01-27, wtc01-28 and wtc01-36 were selected for this analysis (See sample location map for exact collection sites). Amphibole asbestos was not detected in the dust samples by SEM/EDS analysis. However, trace amounts of chrysotile asbestos have been identified in several of the samples. There are also abundant glass fibers in all samples analyzed so far. Other phases found in these samples include gypsum and/or anhydrite (calcium sulfate minerals), calcium-rich phases compatible with concrete materials, and rock and mineral fragments such as quartz and feldspar. A large variety of other materials are present at trace levels including unidentified organic materials compatible with wood, paper, etc., and particles enriched in Fe, Pb, Zn, Sr, Bi, Cu and other metals. Preliminary SEM and EDS analysis of material coating a steel beam (sample 8) from the WTC debris indicates that chrysotile asbestos is present at a level possibly as high as 20% by volume. So far, no amphibole asbestos has been detected in this material. This material also contains abundant glass fibers. Energy dispersive x-ray microanalysis (EDS) was performed to determine the chemical composition of selected materials in the dust. Representative compositions of the glass fibers are given in Table SEM-1. The chemical composition of the majority of glass fibers (and glass spheres) in all samples is consistent with slag wool, a synthetic fiber commonly used in building materials like ceiling tiles (Nomenclature Committee of TIMA Inc., 1991). Glass fibers of other compositions were also found in some of the dust samples (see Table SEM-1, analysis wtc 22 sp2), and may indicate a different source material. Sample 8, collected from a coating on a steel beam, contains glass fibers, chrysotile and gypsum and/or anhydrite. The chrysotile in sample 8 is similar in composition and appearance to that found as a trace phase in the dust samples. SEM Figure 1 is a scanning electron microscope (SEM) image of a representative portion of sample 22, collected from an area near the World Trade Center. SEM Figure 2 is an image of a representative portion of sample 3 collected near Battery Park. Both images show abundant glass fibers along with particulate debris. SEM Figure 3 is an image of a bundle of chrysotile asbestos from sample 8. The chrysotile was found as a trace constituent in two of the samples analyzed so far by SEM/EDS and in several others analyzed by XRD. SEM Figure 4 is a SEM image of gypsum and/or anhydrite particles consistent with dry wall material. Representative analyses of some of these phases are given in Table SEM-1. Images from other samples can be seen in the Integration of Results section. Sample 36 was recovered from an indoor location near the Trade Center complex and had not been affected by rain as were the outdoor samples. This sample was thoroughly analyzed for metal-rich particles to better understand the types of materials from which metals might be leached (see leachate studies section). Images of several metal-rich particles can bee seen by clicking here. |
USGS: World Trade Center USGS Bulk Chemistry Results
|
Chemical compositions of the WTC dusts and girder coating materia Representative splits of samples of dusts from the WTC area and of steel girder coatings from the WTC debris were analyzed for total major element composition by Wavelength-Dispersive X-Ray Fluorescence (WD-XRF), for total major and trace element composition by Inductively Coupled-Plasma Mass Spectrometry (ICP-MS), for total carbon and sulfur by combustion, and for carbonate carbon by coulometric titration. Sampling and analytical methods Representative sub-samples of the dust and beam-coating samples were obtained using a standard cone and quartering approach. The sub-samples were then ground and homogenized prior to chemical analysis. X-ray fluorescence analytical methods, which are summarized in Arbogast (1996), involve heating the sample at 925°C for 40 minutes to determine the weight of volatiles lost from the sample. The sample is then mixed with lithium tetraborate and fused for 56 minutes at 1120°C. The molten sample is poured into a mold and cooled, producing a homogeneous glass disc of the sample material. This disc is then analyzed in a WD-XRF spectrometer, and results are given in total weight percent. The amounts of volatile components in a sample, such as organic material (wood, paper, plastic, other organic compounds), water, sulfur, inorganic carbon, and nitrogen compounds, can be determined by the weight lost by the sample during its initial heating. ICP-MS analysis was carried out on splits of the samples that were first dissolved using a multi-acid digestion combining hydrochloric, hydrofluoric, nitric, and perchloric acids (Crock et al.,1999, and references therein). ICP-MS methods are given in Briggs and Meier (1999), and Crock et al. (1999). Total carbon and total sulfur were analyzed by combustion (Crock et al., 1999). Carbonate carbon was determined by coulometric titration, and organic carbon determined by the the difference between total carbon and carbonate carbon (Crock et al., 1999). Analytical results are tabulated in Chemistry Table 1, and summarized graphically in Chemistry Figures 1-4. The elements measured by the chemical analyses are those routinely measured by the USGS for studies of rocks, sediments, soils, and environmental samples. Total mercury concentrations have not been measured in the WTC solid samples, but have been measured in leach solutions derived from the samples (see the next section of this report). Quality-assurance, quality control data and information for the analyses are available upon request. These analytical methods determine the total concentration (in weight percent or parts per million) of each element in any given sample. The samples are likely to contain a mixture of different components, such as particles of gypsum, concrete, steel, etc., that together make up the total concentration of elements.
IMG: http://pubs.usgs.gov/of/2001/ofr-01-0429/chem1/wtcchemfig1new11-7.gif URL: http://pubs.usgs.gov/of/2001/ofr-01-0429/chem1/index.html Caption: Plot showing the concentration ranges (colored boxes) and means (horizontal white bars) for major and trace elements in samples of WTC dusts and girder coatings. Several samples had arsenic concentrations below the analytical detection limits, indicated on the graph by the arrow extending downward from the detection limit concentration. Concentrations of some elements (such as tin) were not determined n these samples. For comparison, 1 percent equals 10,000 parts per million.
IMG: http://pubs.usgs.gov/of/2001/ofr-01-0429/chem1/wtcchemfig4new11-7.gif URL: http://pubs.usgs.gov/of/2001/ofr-01-0429/chem1/index.html Caption: Map of lower Manhattan showing (as stacked bar charts) variations in concentration (in parts per million) of some predominant trace elements of WTC dust and girder coating samples. Dust samples collected indoors are indicated by the single hatch pattern and girder coating samples by the cross-hatch pattern; all others are dust samples collected outdoors. For comparison with Chemistry Figures 2 and 3, 1 percent equals 10,000 parts per million. Results WD-XRF results show that silicon, calcium, sulfur, magnesium, aluminum, iron, and carbon are the predominant elemental components of the dusts. The contents of volatile compounds in the dusts approach nearly 20% by weight. The identities and amounts of volatile components (such as water bonded in minerals and adsorbed onto materials; organic materials such as papers, plastics, etc.) in the samples have not been determined. The WD-XRF analyst noted a smell of burning wood or paper in all of the dust samples during sample combustion, another indication that organic material is present in the dusts. There are no systematic differences in total element composition between the dust samples collected indoors and outdoors, nor are there systematic spatial variations in dust composition between sample sites. The two samples of girder coating material have generally similar major-element concentrations to those in the dust samples. One notable exception is magnesium, which is somewhat elevated in the girder coating sample (WTC01-08) that has higher chrysotile asbestos content (as determined by SEM analysis). The dust and girder coating samples are substantially more variable in their trace element compositions than in their major element compositions. In most dust samples, zinc is the predominant trace metal, with concentrations as high as 3000 parts per million. With the exception of one sample that is high in barium (WTC01-16), the trace metals barium, lead, copper, and chromium are present in concentrations of hundreds of parts per million. Concentrations of other trace metals and metalloids such as molybdenum, antimony, and titanium, are tens of parts per million or less. As with the major elements, there are no discernible differences in trace metal content between the dust samples collected outdoors and those collected indoors. There are also no apparent spatial variations in trace-element composition between sample sites. The girder coating materials (samples WTC01-08, and -09) contain quite low concentrations of trace metals relative to the dust samples. Interpretation The total element compositions of the dust samples reflect the chemical makeup of materials such as: glass fibers (containing silicon, aluminum, calcium, magnesium, sodium, and other elements); gypsum (containing calcium and sulfate); concrete and aggregate (containing calcium and aluminum hydroxides, and a variety of silicate minerals containing silicon, calcium, potassium, sodium, and magnesium); particles rich in iron, aluminum, titanium, and other metals that might be used in building construction; and particles of other components, such as computers, etc. Organic carbon in the dusts is most likely from paper, wallboard binder, and other organic materials. The trace metal compositions of the dust and girder coatings likely reflect contributions of material from a wide variety of sources. Possibilities include metals that might be found as pigments in paints (such as titanium, molybdenum, lead, and iron), or metals that occur as traces in, or as major components of, wallboard, concrete, aggregate, copper piping, electrical wiring, and computer equipment. Further detailed SEM studies of dust and beam coating samples are needed to develop a better understanding of the residences of metals in the samples. A detailed review of the materials used in construction, and the elemental composition of materials commonly found in office buildings would also be useful to understand more completely the potential sources and compositions of the materials in the dusts. It is important to note that the total chemical analyses presented in this section do not provide an indication of the metals in the dusts and girder coating materials that may potentially be bioavailable (readily assimilated by organisms). For example, heavy metals, such as lead, may occur in forms that range from highly soluble to highly insoluble in water or body fluids. Consequently, high concentrations of total lead in dust samples may or may not translate into elevated concentrations of readily bioavailable lead. Chemical leach tests such as those presented in the next section of this study aid in understanding potential release and bioavailability of heavy metals and other constituents from the girder coatings and dust samples. |


Evaluation of World Trade Center dusts and girder coatings using a simulated precipitation leaching procedure
|
A subset of the loose dust samples and samples of material coating girders collected from around the World Trade Center was subjected to chemical leach tests to examine potential release of metals from the dusts and beam coatings. The USGS leach test is a modification of a test described in detail in Hageman and Briggs (2000). This leach test and the one developed by Hageman and Briggs (2000) are modifications of the US EPA 1312 (Synthetic Precipitation Leaching Procedure, or SPLP) method. The USGS tests were originally designed as a screening method to quickly assess potential metal release from mine wastes. As applied to the materials from the World Trade Center, these leach tests can be used to infer the potential for release of various metals, anions, and cations from the dusts as a result of rainfall or interactions with water used in fire fighting or street washing. The test also provides an indication of metals that might be bioavailable should the dusts be inhaled, ingested, or discharged into ecosystems. For this leach test, deionized (DI) water (pH ~5.5) is used as the extractant. Dust samples were leached at a 1:20 ratio (2.5 grams dust / 50 milliliters DI water). A representative subsample of each dust sample was weighed on a balance. Each dust sample was then placed in a 125 milliliter (ml) high-density polyethylene (HDPE) bottle to which 50.0 ml DI water was added. Each sample was then shaken for 5 minutes. Following shaking, the solution was allowed to settle for 5 minutes. Leachate solutions were then filtered using plastic syringes and 0.45 micrometer pore size nitrocellulose membrane filters. Sub-samples of the leachate were collected and preserved for further analysis. The procedure uses deionized water as the extractant solution rather than the synthetic acid rain used in the EPA 1312 method. It also uses a 5 minute agitation rather than an 18-hour agitation. Hence, it is possible that the concentrations of soluble metals measured with this test would be less than those measured using EPA 1312 method. However, it is likely that the leach procedure used in this study successfully reveals the metals likely to be mobilized from the dusts and girder coatings. A comparative study between the EPA Method 1312 (SPLP) procedure and this simplified leach can be found in Hageman and Briggs (2000). The leachate samples were analyzed for major cations and trace metals by Inductively-Coupled Plasma-Mass Spectrometry (ICP-MS) following the protocols outlined by Lamothe et al. (1999) and for anions by ion chromatography. The elements measured by the chemical analyses are those routinely measured by the USGS for studies of rocks, sediments, soils, and environmental samples. Leachate solutions for a subset of the dust samples were also analyzed for dissolved mercury concentrations. For these samples, an aliquot was filtered using a syringe and disposable 0.45 micrometer pore size nitrocellulose filter, and then acidified and preserved by the addition of a 1 percent sodium dichromate/concentrated nitric acid solution in a ratio of 1:19 (one part sodium dichromate/nitric acid solution to 19 parts water sample). Leachate samples were stored in nitric acid-washed, flint glass bottles with Teflon lined lids. Samples were then analyzed for mercury using a Lachat QuikChem Mercury Analyzer with fluorescence detector. This method has a lower reporting limit of 5 part per trillion (ng/L). Quality assurance-quality control information for the process and the chemical analyses are available upon request.
IMG: http://pubs.usgs.gov/of/2001/ofr-01-0429/leach1/wtcleachfig1_11-1.gif URL: http://pubs.usgs.gov/of/2001/ofr-01-0429/leach1/ Caption: Leach Figure 1. Plots showing the ranges (blue boxes) and means (horizontal white bars) in pH and specific conductance (upper plot), major cations and anions (middle plot), and trace elements (lower plot) in leachate solutions from WTC dusts and girder coatings. Elements for which one or more samples were below the analytical detection limits are indicated by arrows extending downward from the detection limit concentration. Abbreviations: mg/L = milligrams per liter (approximately the same as parts per million); µg/L = micrograms per liter (approximately the same as parts per billion); mS/cm = milliSiemens per centimeter. For comparison, 1 milligram per liter equals 1000 micrograms per liter, and 1 part per million equals 1000 parts per billion. Also, one mS/cm in specific conductance is approximately equal to 1000 milligrams per liter dissolved solids. [..] Results Results of the leach tests are summarized in Leach Table 1, and in Leach Figures 1-6. The metal concentrations summarized in Leach Table 1 may not represent truly dissolved material, because the nitrocellulose filter (0.45 micrometer pore size) used to filter the leachate fluids prior to analysis will not filter out metals present in very small particles or colloids. Interpretation In general, the leachate solutions developed moderately alkaline to alkaline pH values (8.2 – 11.8), and high specific conductances (1.31 – 3.41 milliSiemens/cm, indicating high dissolved solids). Alkalinities of the leachate solutions were not measured due to insufficient sample volume, but are by inference from the pH and specific conductances, likely to be quite high. The leachate solutions are composed primarily of sulfate, bicarbonate, carbonate, and calcium, with lesser concentrations of the major cations sodium, potassium, and magnesium. The alkaline pH of the leach solutions, coupled with the high concentrations of calcium, carbonate, and sulfate, are consistent with an origin resulting primarily from the dissolution of concrete, glass fibers, gypsum, and other material in the dusts. The leach fluids with the highest pH and highest specific conductance are from dust samples collected indoors (including WTC01-20, collected indoors from the gymnasium across West Street from the World Trade Center, and WTC01-36, which was collected in a 30th-floor apartment in a building southwest of the WTC). The higher specific conductances and pH values of indoor dust samples indicate that the outdoor samples have already experienced some leaching by rainfall and water used for fighting fires and street cleaning between September 11 and the time that the samples were collected. Leach solutions from the indoor dust samples also contain slightly less sulfate, but greater calcium, than leach solutions from several outdoor dust samples (Leach Figure 2). This suggests that dissolution of concrete or glass fibers is greater in the indoor dusts than in the outdoor dusts, and is another indication that the outdoor dusts have already undergone some leaching by rainfall or wash waters. Heavy metals and metalloids are present in low to quite high concentrations in many of the leach solutions Leach Table 1, Leach Figure 1). Mercury is present in generally low concentrations in the leachate solutions from outdoor dust samples (near 10 nanograms per liter, or parts per trillion). Mercury concentrations in leachate solutions from indoor dust samples (as high as 130 nanograms per liter), although low compared to concentrations of other metals in the leachate solutions, are relatively high compared to mercury concentrations measured in many types of environmental water samples. Arsenic, cobalt, cadmium, thorium, and uranium are present in relatively low concentrations in the leachate solutions (maximum concentrations of 3.3, 3.2, 1.6, 0.5, and 0.5 micrograms per liter, µg/L, respectively). Lead, selenium, and vanadium are present in moderate concentrations (maximum concentrations of 11.5, 10.5, and 16.1 µg/L, respectively). Metals or metalloids present in relatively high concentrations in the leachate solutions include (maximum concentrations listed in parentheses): aluminum (702 µg/L), chromium (403 µg/L), antimony (74 µg/L), molybdenum (140 µg/L), barium (62 µg/L), manganese (35 µg/L), copper (39 µg/L), and zinc (62 µg/L). Of the various major and trace elements, aluminum is leached in greatest amounts from the indoor dust samples relative to outdoor dust samples. This indicates that the indoor dusts, in addition to having a greater proportion of reactive concrete, also contain some sort of reactive aluminum-bearing material. This material has presumably been partly to largely leached from the outdoor dusts by rain water and wash water. Leachate solution from one of the beam coating samples (WTC01-09) contain unusually high amounts of chromium (408 µg/L). As noted in the SEM section, the mineralogy of this sample is generally similar to those of the dust samples in overall mineralogy. However, the source of the leachable chromium in the material is currently unknown. The source of the metals and metalloids in the leach solutions is unclear, but many components of the dust and debris are possible sources, including particles from concrete, aggregate, gypsum wallboard, glass fibers, construction steel, wiring, computer equipment, etc. The results of the leach tests also show that metals are not leached from the dusts and beam coating samples in proportion to their total concentrations in the samples (compare concentrations in Leach Table 1 with those in Chemistry Table 1 from the previous section). For example, chromium, molybdenum, and antimony are leached in relatively high amounts from the samples, but occur in relatively low total concentrations in the samples. In part, these trace elements are likely being leached in greater proportions from the samples due to their enhanced solubilities in alkaline solutions. It is also possible that they are being leached more aggressively because they may occur in materials that are more readily dissolved in alkaline solutions. In contrast, iron, zinc and lead, which are relatively more abundant in the samples (Chemistry Table 1), are leached in proportionally quite low amounts from the samples (Leach Table 1). These metals are generally less mobile in alkaline solutions, and may also occur in materials that are not readily soluble in alkaline solutions. Summary and potential environmental implications Results of the leach tests indicate that the dusts released from the WTC collapse, when exposed rainwater or wash water, likely produce slightly alkaline to quite alkaline, calcium-sodium-potassium-sulfate-bicarbonate-carbonate solutions. At least some heavy metals and metalloids may be readily leached from the dusts: aluminum, chromium, antimony, molybdenum, and barium are generally leached in the greatest amounts, but other metals such as zinc, copper, manganese, titanium, vanadium, lead and mercury are also leached in measurable quantities. It is unclear if these heavy metals and metalloids may be leached in sufficient quantities to be of environmental or health concern. These results indicate that continued EPA monitoring of runoff water quality is warranted. Continued rainfall will likely continue to decrease the amounts of metals and alkalinity that can be released from the outdoor dusts. The results of the leach tests also indicate that cleanup of dusts should be done with appropriate respiratory protection to prevent possible inhalation of alkaline material with potentially bioavailable heavy metals and metalloids. This is especially true for cleanup of dusts from indoor localities that have not been exposed to rainfall. |

Nuclear fission product – from Wikipedia
|
Nuclear fission products are the atomic fragments left after a large atomic nucleus fissions. Typically, a large nucleus like that of uranium fissions by splitting into two smaller nuclei, along with a few neutrons and a large release of energy in the form of heat (kinetic energy of the nuclei), gamma rays and neutrinos. The two smaller nuclei are the “fission products”. [..] Formation and decay The sum of the atomic weight of the two atoms produced by the fission of one atom is always less than the atomic weight of the original atom. This is because some of the mass is lost as free neutrons and large amounts of energy. Since the nuclei that can readily undergo fission are particularly neutron-rich (e.g. 61% of the nucleons in uranium-235 are neutrons), the initial fission products are almost always more neutron-rich than stable nuclei of the same mass as the fission product (e.g. stable ruthenium-100 is 56% neutrons, stable xenon-134 is 60%). The initial fission products therefore may be unstable and typically undergo beta decay towards stable nuclei, converting a neutron to a proton with each beta emission. (Fission products do not emit alpha particles.) A few neutron-rich and short-lived initial fission products first decay by emitting a neutron. This is the source of delayed neutrons which play an important role in control of a nuclear reactor. The first beta decays are rapid, and may release high energy beta particles or gamma radiation. However, as the fission products approach stable nuclear conditions, the last one or two decays may have a long halflife and release less energy. There are a few exceptions with relatively long halflives and high decay energy, such as: * Sr-90 (high energy beta, halflife 30 years) * Cs-137 (high energy gamma, halflife 30 years) * Sn-126 (even higher energy gamma, but long halflife of 230,000 years means a slow rate of radiation release, and the yield of this nuclide per fission is very low) Radioactivity over time Fission products have half-lives of 90 years (Samarium-151) or less, except for seven long-lived fission products with half-lives of 211,100 years (Technetium-99) and more. Therefore the total radioactivity of fission products decreases rapidly for the first several hundred years, before stabilizing at a low level that changes little for hundreds of thousands of years. This contrasts with actinides produced in the open (no reprocessing) nuclear fuel cycle, a number of which have half-lives in the missing range of about 102 to 105 years. Proponents of nuclear fuel cycles which aim to consume all their actinides by fission, such as the Integral Fast Reactor and molten salt reactor, use this fact to claim that within 200 years, their wastes are no more radioactive than the original uranium ore. Fission products emit beta radiation, while actinides primarily emit alpha radiation. Many of each also emit gamma radiation. Yield Each fission of a parent atom produces a different set of fission product atoms. However, while an individual fission is not predictable, the fission products are statistically predictable. The amount of any particular isotope produced per fission is called its yield, typically expressed as % per parent fission; therefore, yields total to 200% not 100%. While fission products include every element from zinc through the lanthanides, the majority of the fission products occurs in two peaks. One peak occurs at about (expressed by atomic number) strontium to ruthenium while the other peak is at about tellurium to neodymium. The exact yield is somewhat dependent on the parent atom, and also on the energy of the initiating neutron. In general the higher the energy of the state that undergoes nuclear fission, the more likely that the two fission products have similar mass. Hence as the neutron energy increases and/or the energy of the fissile atom increases, the valley between the two peaks becomes more shallow. For instance, the curve of yield against mass for Pu-239 has a more shallow valley than that observed for U-235 when the neutrons are thermal neutrons. The curves for the fission of the later actinides tend to make even more shallow valleys. In extreme cases such as 259Fm, only one peak is seen. The adjacent figure shows a typical fission product distribution from the fission of uranium. Note that in the calculations used to make this graph, the activation of fission products was ignored and the fission was assumed to occur in a single moment rather than a length of time. In this bar chart results are shown for different cooling times — time after fission. Because of the stability of nuclei with even numbers of protons and/or neutrons, the curve of yield against element is not a smooth curve but tends to alternate. Note that the curve against mass number is smooth. […] Fission product decay with time For fission of uranium-235, the predominant radioactive fission products include isotopes of iodine, caesium, strontium, xenon and barium. It is important to understand that the size of the threat becomes smaller with the passage of time. Locations where radiation fields once posed immediate mortal threats, such as much of the Chernobyl Power Plant on day one of the accident and the ground zero sites of Japanese atomic bombings (6 hours after detonation), are now safe as the radioactivity has decayed to a very low level. See for instance the graph [..] of the gamma dose rate due to Chernobyl fallout as a function of time after the accident. Many of the fission products decay through very short-lived isotopes to form stable isotopes, but a considerable number of the radioisotopes have half lives longer than a day. The radioactivity in the fission product mixture is mostly due to short lived isotopes such as I-131 and 140Ba, after about four months 141Ce, 95Zr/95Nb and 89Sr take the largest share, while after about two or three years the largest share is taken by 144Ce/144Pr, 106Ru/106Rh and 147Pm. Later 90Sr and 137Cs are the main radioisotopes, being succeeded by 99Tc. In the case of a release of radioactivity from a power reactor or used fuel, only some elements are released; as a result, the isotopic signature of the radioactivity is very different from an open air nuclear detonation, where all the fission products are dispersed. [..]
Screen capture from: http://en.wikipedia.org/wiki/Nuclear_fission_product Fission products in nuclear weapons Nuclear weapons use fission as either the partial or the main energy source. Depending on the weapon design and where it is exploded, the relative importance of the fission product radioactivity will vary compared to the activation product radioactivity in the total fallout radioactivity. The immediate fission products from nuclear weapon fission are essentially the same as those from any other fission source, depending slightly on the particular nuclide that is fissioning. However, the very short time scale for the reaction makes a difference in the particular mix of isotopes produced from an atomic bomb. For example, the 134Cs/137Cs ratio provides an easy method of distinguishing between fallout from a bomb and the fission products from a power reactor. Almost no Cs-134 is formed by nuclear fission (because xenon-134 is stable). The 134Cs is formed by the neutron activation of the stable 133Cs which is formed by the decay of isotopes in the isobar (A = 133). So in a momentary criticality by the time that the neutron flux becomes zero too little time will have passed for any 133Cs to be present. While in a power reactor plenty of time exists for the decay of the isotopes in the isobar to form 133Cs, the 133Cs thus formed can then be activated to form 134Cs only if the time between the start and the end of the criticality is long. According to Jiri Hala’s textbook the radioactivity in the fission product mixture (due to an atom bomb) is mostly caused by short-lived isotopes such as I-131 and Ba-140. After about four months Ce-141, Zr-95/Nb-95, and Sr-89 represent the largest share of radioactive material. After two to three years, Ce-144/Pr-144, Ru-106/Rh-106, and Promethium-147 are the bulk of the radioactivity. After a few years, the radiation is dominated by Strontium-90 and Caesium-137, whereas in the period between 10,000 and a million years it is Technetium-99 that dominates. [..] Countermeasures against the worst fission products found in accident fallout Iodine At least three isotopes of iodine are important. 129I, 131I (radioiodine) and 132I. [..] Open air nuclear testing and the Chernobyl disaster both released iodine-131. The short-lived isotopes of iodine are particularly harmful because the thyroid collects and concentrates iodide — radioactive as well as stable. Absorption of radioiodine can lead to acute, chronic, and delayed effects. Acute effects from high doses include thyroiditis, while chronic and delayed effects include hypothyroidism, thyroid nodules, and thyroid cancer. It has been shown that the active iodine released from Chernobyl and Mayak has resulted in an increase in the incidence of thyroid cancer in the former Soviet Union. One measure which protects against the risk from radio-iodine is taking a dose of potassium iodide before exposure to radioiodine. The non-radioactive iodide ‘saturates’ the thyroid, causing less of the radioiodine to be stored in the body. Administering potassium iodide reduces the effects of radio-iodine by 99%, and is a prudent, inexpensive supplement to fallout shelters. The Food and Drug Administration (FDA) has approved potassium iodide as an over-the-counter medication. As with any medication, individuals should check with their doctor or pharmacist before using it. A low-cost alternative to commercially available iodine pills is a saturated solution of potassium iodide. It usually possible to obtain several thousand doses for prices near US$ 0.01/dose. Long term storage of KI is normally in the form of reagent grade crystals, which are convenient and available commercially. The purity is superior to “pharmacologic grade”. Its concentration depends only on temperature, which is easy to determine, and the required dose is easily administered by measuring the required volume of the liquid. At room temperature, the U.S. standard adult radiological protective dose of 130 mg is four drops of a saturated solution. A baby’s dose is 65 mg, or two drops. It should be noted that these doses are sufficient to cause nausea and sometimes emesis in most individuals. It’s normally administered in a ball of bread, because it tastes incredibly bad. Use is contraindicated in individual known to be allergic to iodine; for such persons sodium perchlorate is one alternative. Caesium The Chernobyl accident released a large amount of caesium isotopes, these were dispersed over a wide area. Cs-137 is an isotope which is of long term concern as it remains in the top layers of soil. Plants with shallow root systems tend to absorb it for many years. Hence grass and mushrooms can carry a considerable amount of Cs-137 which can be transferred to humans through the food chain. One of the best countermeasures in dairy farming against Cs-137 is to mix up the soil by deeply ploughing the soil. This has the effect of putting the Cs-137 out of reach of the shallow roots of the grass, hence the level of radioactivity in the grass will be lowered. Also the removal of top few cm of soil and its burial in a shallow trench will reduce the dose to humans and animals as the gamma photons from Cs-137 will be attenuated by their passage through the soil. The deeper and more remote the trench is, the better the degree of protection. Fertilizers containing potassium can be used to dilute caesium and limit its uptake by plants. In livestock farming another countermeasure against Cs-137 is to feed to animals a little prussian blue. This iron potassium cyanide compound acts as a ion-exchanger. The cyanide is so tightly bonded to the iron that it is safe for a human to eat several grams of prussian blue per day. The prussian blue reduces the biological half life (different from the nuclear half life) of the caesium. The physical or nuclear half life of Cs-137 is about 30 years. This is a constant which can not be changed but the biological half life is not a constant. It will change according to the nature and habits of the organism it is expressed for. Caesium in humans normally has a biological half life of between one and four months. An added advantage of the prussian blue is that the caesium which is stripped from the animal in the droppings is in a form which is not available to plants. Hence it prevents the caesium from being recycled. The form of prussian blue required for the treatment of humans or animals is a special grade. Attempts to use the pigment grade used in paints have not been successful. For further details of the use of prussian blue please see the IAEA report on the Goiânia accident. Strontium The addition of lime to soils which are poor in calcium can reduce the uptake of strontium by plants. Likewise in areas where the soil is low in potassium, the addition of a potassium fertiliser can discourage the uptake of caesium into plants. However such treatments with either lime or potash should not be undertaken lightly as they can alter the soil chemistry greatly so resulting in a change in the plant ecology of the land. [..] Alimentary absorption of fission products For introduction of radionuclides into organism, ingestion is the most important route. Insoluble compounds are not absorbed from the gut and cause only local irradiation before they are excreted. Soluble forms however show wide range of absorption percentages.
Screen capture from http://en.wikipedia.org/wiki/Nuclear_fission_product |


Decay chain – from Wikipedia
|
Beta decay chains in uranium & plutonium fission products Since the heavy original nuclei always have a greater proportion of neutrons, the fission product nuclei almost always start out with a neutron/proton ratio significantly greater than what is stable for their mass range. Therefore they undergo multiple beta decays in succession, each converting a neutron to a proton. The first decays tend to have higher decay energy and shorter half-life. These last decays may have low decay energy and/or long half-life. For example, uranium-235 has 92 protons and 143 neutrons. Fission takes one more neutron, then produces two or three more neutrons; assume that 92 protons and 142 neutrons are available for the two fission product nuclei. Suppose they have mass 99 with 39 protons and 60 neutrons (yttrium-99), and mass 135 with 53 protons and 82 neutrons (iodine-135), then the decay chains can be found in the tables below.
Screen capture from: http://en.wikipedia.org/wiki/Decay_chain |

Fission products by element – from Wikipedia
|
Krypton 83-86 83Kr 84Kr 85Kr 86Kr Krypton-85 is formed by the fission process with a fission yield of about 0.3%. Only 20% of the fission products of mass 85 become 85Kr itself; the rest passes through a short-lived nuclear isomer and then to stable 85Rb. If irradiated reactor fuel is reprocessed, this radioactive krypton is released into the air. This krypton release can be detected and used as a means of detecting clandestine nuclear reprocessing. Strictly speaking, the stage which is detected is the dissolution of used nuclear fuel in nitric acid, as it is at this stage that the krypton and other fission gases like the more abundant xenon are released. Increase of fission gases above a certain limit can lead to fuel pin swelling and even puncture, so that fission gas measurement after discharging the fuel from the reactor is most important to make burn-up calculations, to study the nature of fuel inside the reactor, behaviour with pin materials, for effective utilisation of fuel and also reactor safety. Strontium 88-90 88Sr 89Sr 90Sr The strontium radioisotopes are very important as strontium is a calcium mimic which is incorporated in bone growth and therefore has a great ability to harm humans. On the other hand, this also allows 89Sr to be used in the open source radiotherapy of bone tumors. This tends to be used in palliative care to reduce the pain due to secondary tumors in the bones. Strontium-90 is a strong beta emitter with a half-life of 28.8 years. Its fission product yield decreases as the mass of the fissile nuclide increases. A map of 90Sr contamination around Chernobyl has been published by the IAEA. Yttrium 89 89Y 90Y 91Y The only stable yttrium isotope, 89Y, will be found with yield somewhat less than 1% in a fission product mixture which has been allowed to age for months or years, as the other isotopes have half-lives of 106.6 days or less. 90Sr decays into 90Y which is a beta emitter with a half life of 2.67 days. 90Y is sometimes used for medical purposes and can be obtained either by the neutron activation of stable 89Y or by using a device similar to a technetium cow. Zirconium 90-96 90Zr 91Zr 92Zr 93Zr 94Zr 95Zr 96Zr A significant amount of zirconium is formed by the fission process; some of this are short-lived radioactives (95Zr and 97Zr which decay to molybdenum), while almost 10% of the fission products mixture after years of decay consists of five stable or nearly stable isotopes of zirconium plus 93Zr with a halflife of 1.53 million years which is one of the 7 major long-lived fission products. In PUREX plants the zirconium sometimes forms a third phase which can be a disturbance in the plant. The third phase is the term in solvent extraction given to a third layer (such as foam and/or emulsion) which forms from the two layers in the solvent extraction process. The zirconium forms the third phase by forming small particles which stabilise the emulsion which is the third phase. Molybdenum 95, 97, 98, 100 95Mo 97Mo 98Mo 99Mo 100Mo The fission product mixture contains significant amounts of molybdenum. Technetium 99 99Tc 99Tc is produced at a yield of about 6% per fission; see also the main fission products page. Ruthenium 101-106 101Ru 102Ru 103Ru 104Ru 105Ru 106Ru Plenty of both stable ruthenium and radioactive ruthenium-103 is formed by the fission process. The ruthenium in PUREX raffinate can become oxidized to form ruthenium tetroxide which forms a purple vapour to appear above the surface of the aqueous liquor. The ruthenium tetroxide is very similar to osmium tetroxide, the ruthenium compound is a stronger oxidant which enables it to form deposits by reacting with other substances. In this way the ruthenium in a reprocessing plant is very mobile and can be found in odd places. Also at Chernobyl during the fire the ruthenium became volatile and behaved differently to many of the other metallic fission products. Some of the particles which were emitted by the fire were very rich in ruthenium. In addition the ruthenium in PUREX raffinate forms a large number of nitrosyl complexes which makes the chemistry of the ruthenium very complex. The ligand exchange rate at ruthenium and rhodium tends to be long, hence it can take a long time for a ruthenium or rhodium compound to react. It has been suggested that the ruthenium and palladium in PUREX raffinate should be used as a source of the metals. Rhodium 103 103Rh 105Rh While less rhodium than ruthenium and palladium is formed (around 3.6% yield), the mixture of fission products still contains a significant amount of this metal. Due to the high prices of ruthenium, rhodium and palladium some work has been done on the separation of these metals to enable them to be used at a later date. Because of the possibility of the metals being contaminated by radioactive isotopes, metals are not suitable for making consumer products such as jewellery but this source of the metals could be used for catalysts in industrial plants such as petrochemical plants. [..] A dire example of people being exposed to radiation from contaminated jewellery occurred in the USA where it is thought that the gold seeds which were used to contain radon were recycled into jewellery. The gold did contain radioactive decay products of 222Rn. [..] Palladium 105-110 105Pd 106Pd 107Pd 108Pd 109Pd 110Pd A great deal of palladium forms during the fission process, during the fuel dissolution not all of the fission palladium dissolves. Hence the dissolver fines are rich in palladium, also some palladium dissolves at first and then comes out of solution again. The dissolver fines are often removed to prevent them disturbing the solvent extraction process through the stabilisation of the third phase. The fission palladium can separate during the process in which the PUREX raffinate is combined with glass and heated to form the final waste form. The palladium forms an alloy with the fission tellurium. This alloy can separate from the glass. Silver 109 109Ag 111Ag Cadmium 111-116 111Cd 112Cd 113Cd 114Cd 115Cd 116Cd Indium 115In Tin 117-126 117Sn 118Sn 119Sn 120Sn 121Sn 122Sn 123Sn 124Sn 125Sn 126Sn Antimony 121,123 123Sb 125Sb Tellurium 125, 128, 130 125Te 127Te 128Te 129Te 130Te 131Te 132Te Tellurium-132 and its daughter 132I are important in the first few days after a criticality. It was responsible for a large fraction of the dose inflicted on workers at Chernobyl in the first week. The isobar forming 132Te/132I is: Tin-132 (half life 40 s) decaying to antimony-132 (half life 2.8 minutes) decaying to tellurium-132 (half life 3.2 days) decaying to iodine-132 (half life 2.3 hours) which decays to stable xenon-132. Iodine 129, 131 127I 129I 131I 131I and 129I are made by the fission process. In common with 89Sr, 131I is used for the treatment of cancer. A small dose of 131I can be used in a thyroid function test while a large dose can be used to destroy the thyroid cancer. This treatment will also normally seek out and destroy any secondary tumor which arose from a thyroid cancer. Much of the energy from the beta emission from the 131I will be absorbed in the thyroid, while the gamma rays are likely to be able to escape from the thyroid to irradiate other parts of the body. Lots of 131I was released during an experiment named the ‘Green run'[7]. The ‘green run’ was an experiment in which fuel which had only been allowed to cool for a short time after irradiation was reprocessed in a plant which had no iodine scrubber in operation. Xenon 131-136 131Xe 132Xe 133Xe 134Xe 135Xe 136Xe In reactor fuel, the fission product xenon tends to migrate to form bubbles in the fuel. As caesium 133, 135, and 137 are formed by the beta particle decay of the corresponding xenon isotopes, this causes the caesium to become physically separated from the bulk of the uranium oxide fuel. Because 135Xe is a potent nuclear poison with a large cross section for neutron absorption, the buildup of 135Xe in the fuel inside a power reactor can lower the reactivity greatly. If a power reactor is shut down or left running at a low power level, then large amounts of 135Xe can build up through decay of 135I. When the reactor is restarted or the low power level is increased significantly, 135Xe will be quickly consumed through neutron capture reactions and the reactivity of the core will increase. Under some circumstances, control systems may not be able to respond quickly enough to manage an abrupt reactivity increase as the built-up 135Xe burns off. It is thought that xenon poisoning was one of the factors which led to the power surge which damaged the Chernobyl reactor core. Caesium 133, 134, 135, 137 133Cs 134Cs 135Cs 137Cs A lot of caesium is formed by the fission process, please see the section in the main fission product page for further details of caesium as a troublesome isotope in fall-out and nuclear wastes. This element is a key element which allows the fission products from a bomb to be distinguished from power reactor fission products. A map of caesium-137 in the area around Chernobyl has been published by the IAEA.[8] Barium 138, 139 138Ba 139Ba 140Ba A lot of barium is formed by the fission process, a short lived barium isotope was confused with radium by some early workers. They were bombarding uranium with neutrons in an attempt to form a new element. But instead they caused fission which generated a large amount of radioactivity in the target. Because the chemistry of barium and radium the two elements could be coseparated by for instance a precipitation with sulfate anions. Because of this similarity of their chemistry the early workers thought that the very radioactive fraction which was separated into the “radium” fraction contained a new isotope of radium. Some of this early work was done by Otto Hahn and Fritz Strassmann. http://en.wikipedia.org/wiki/Fission_products_%28by_element%29 |
Penetrating power of radiation

Radionuclides are the most definitive signature of a nuclear explosion
|
The most definitive signature of a nuclear explosion is the presence of radionuclides, a collective term for the radioactive isotopes produced by a nuclear reaction. While “fallout” was most obvious when early tests were conducted above-ground, underground and underwater tests also tend to leak radiation into the atmosphere. The detection process, which looks for key indicators like the ratio of different xenon isotopes, takes several days and can’t pinpoint the exact origin of the blast. But once a signal is detected, there’s no doubt a nuclear explosion has taken place. http://www.popularmechanics.com/science/environment/4199444 (Nuke Watch: How Scientists Sniffed Out N. Korea – Popular Mechanics) |
Penetrating power of ionizing radiation

Img: http://upload.wikimedia.org/wikipedia/commons/thumb/7/7c/Alfa_beta_gamma_neutron_radiation.svg/250px-Alfa_beta_gamma_neutron_radiation.svg.png URL: http://en.wikipedia.org/wiki/Ionizing_radiation Caption: Alpha (α) radiation consists of a fast moving helium-4 (He-4) nucleus and is stopped by a sheet of paper. Beta (β) radiation, consisting of electrons, is halted by an aluminium plate. Gamma (γ) radiation, consisting of energetic photons, is eventually absorbed as it penetrates a dense material. Neutron (n) radiation consists of free neutrons which are blocked using light elements, like hydrogen, which slow and/or capture them.

Img: http://upload.wikimedia.org/wikipedia/commons/thumb/8/8c/Types_of_radiation.svg/632px-Types_of_radiation.svg.png URL: http://en.wikipedia.org/wiki/Ionizing_radiation Caption: Types of radiation – gamma rays are represented by wavy lines, charged particles and neutrons by straight lines. The little circles show where ionization processes occur.
High strontium-90 levels in fish in the Hudson River
This report is dated November 2009.
|
Hudson River Fish Found to Contain Radioactive Isotope By Greg Clary BUCHANAN – In what could be the region’s next environmental controversy or simply just a laboratory mistake, fish in the Hudson River have been found to contain traces of strontium 90. The radioactive isotope was discovered leaking almost a year ago at the Indian Point nuclear plants, and tests on 12 fish show four with detectible amounts, according to a memo obtained by The Journal News. The tests were conducted for Entergy Nuclear Northeast, which owns the plants, after researchers pulled the fish from the river during the summer – six from the Newburgh-Beacon Bridge area, and the rest from around Indian Point. “Certainly it’s of concern that the strontium was found in 25 percent of the sampling,” said C. J. Miller, spokeswoman for Rockland County Executive C. Scott Vanderhoef. http://www.rawfoodinfo.com/articles/art_strontium90inHudson.html |
Note that the Indian Point nuclear power plant is located in Buchanan, New York State, on the east bank of Hudson River. More studies will have to be performed to pinpoint the exact source of the strontium-90.
Pdf report for download: strontium90-hudson-river-report
_______________________________________________________________

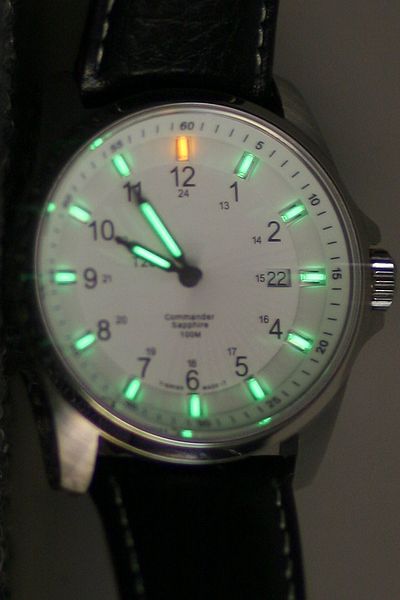
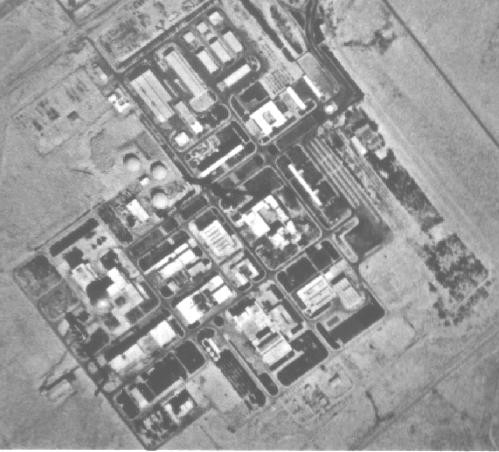
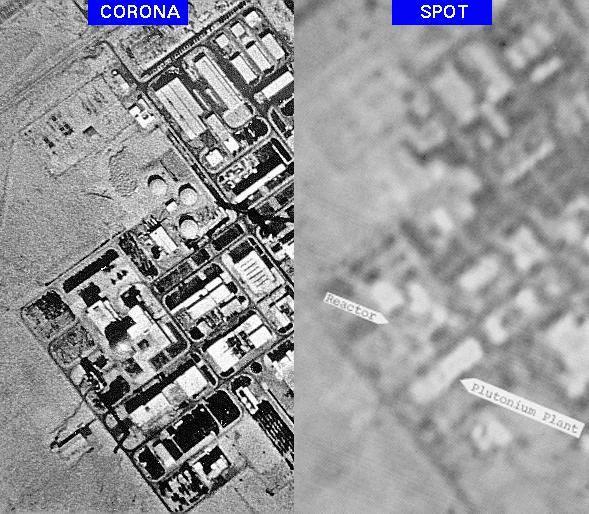
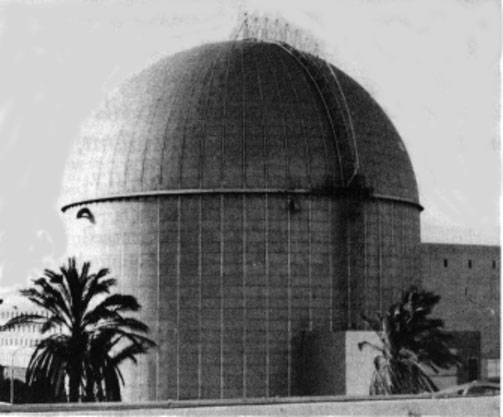
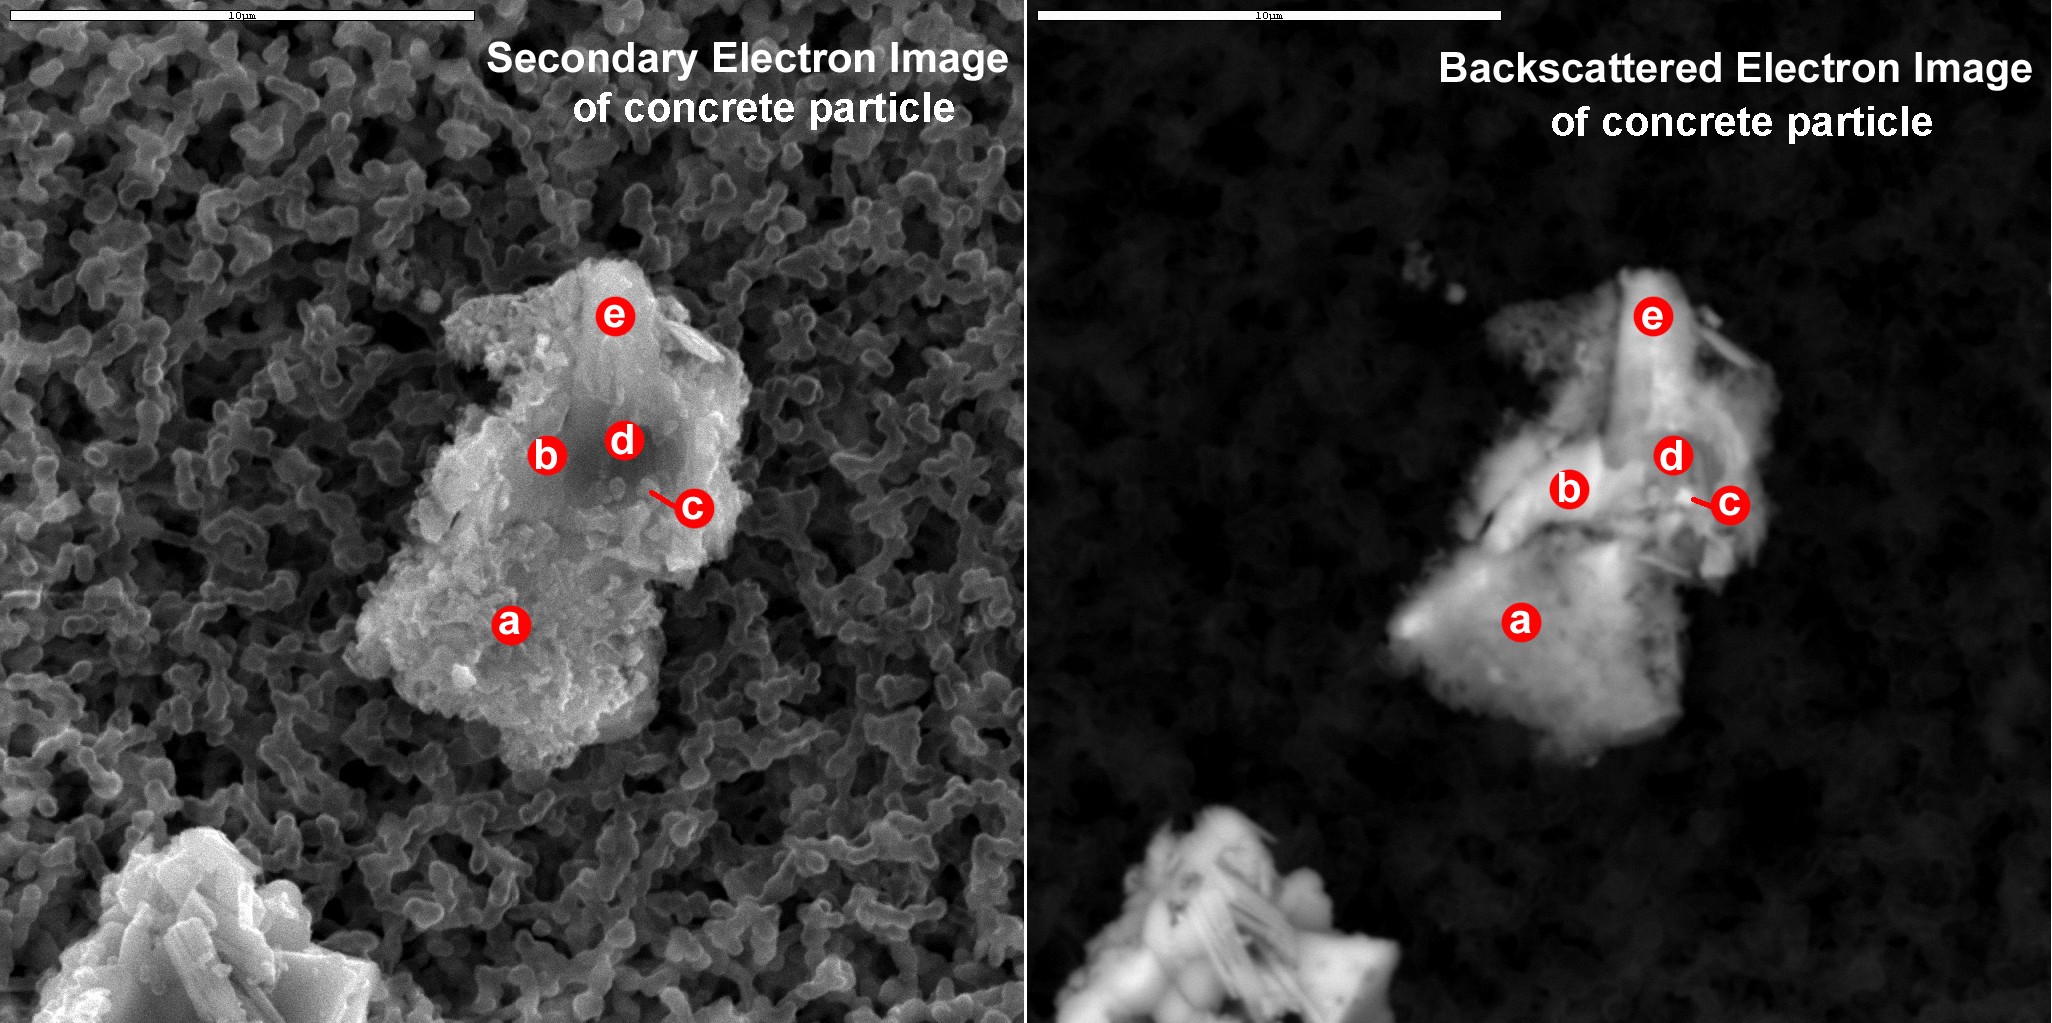
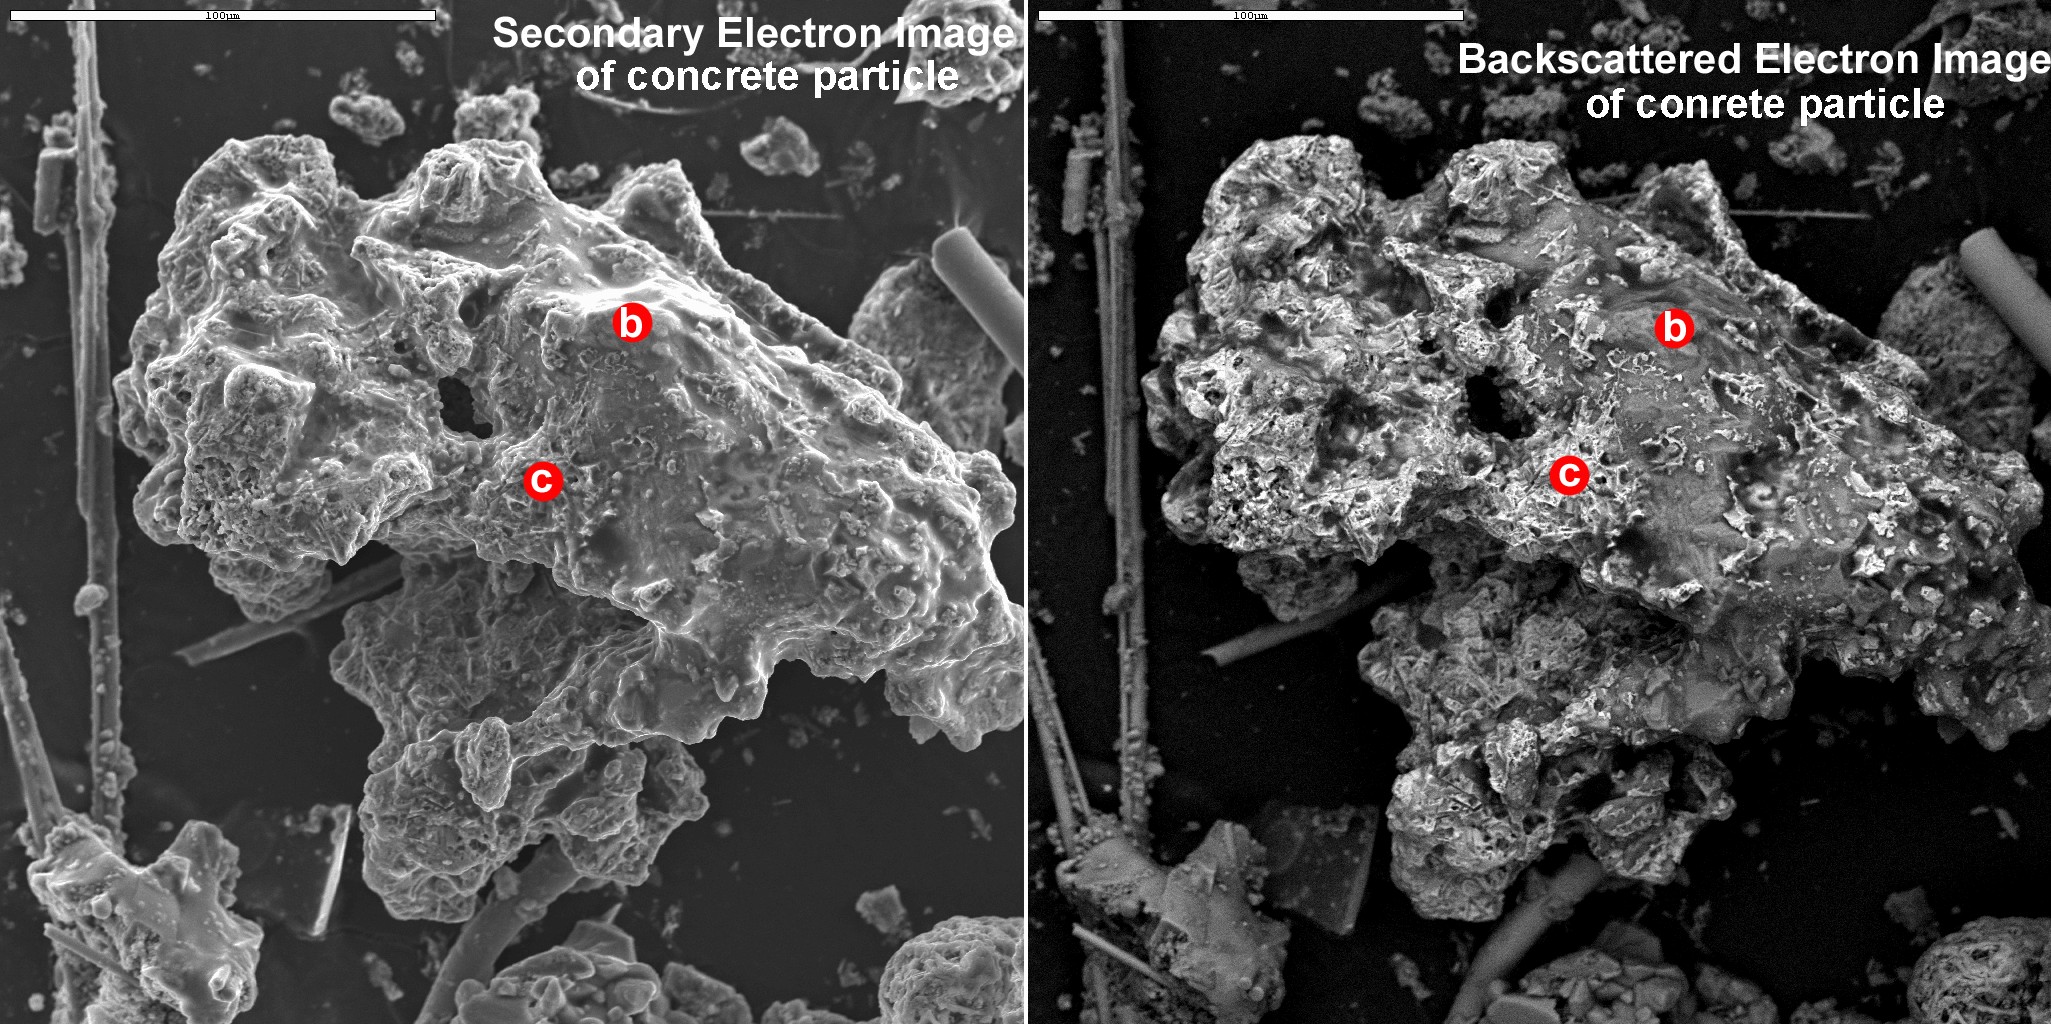
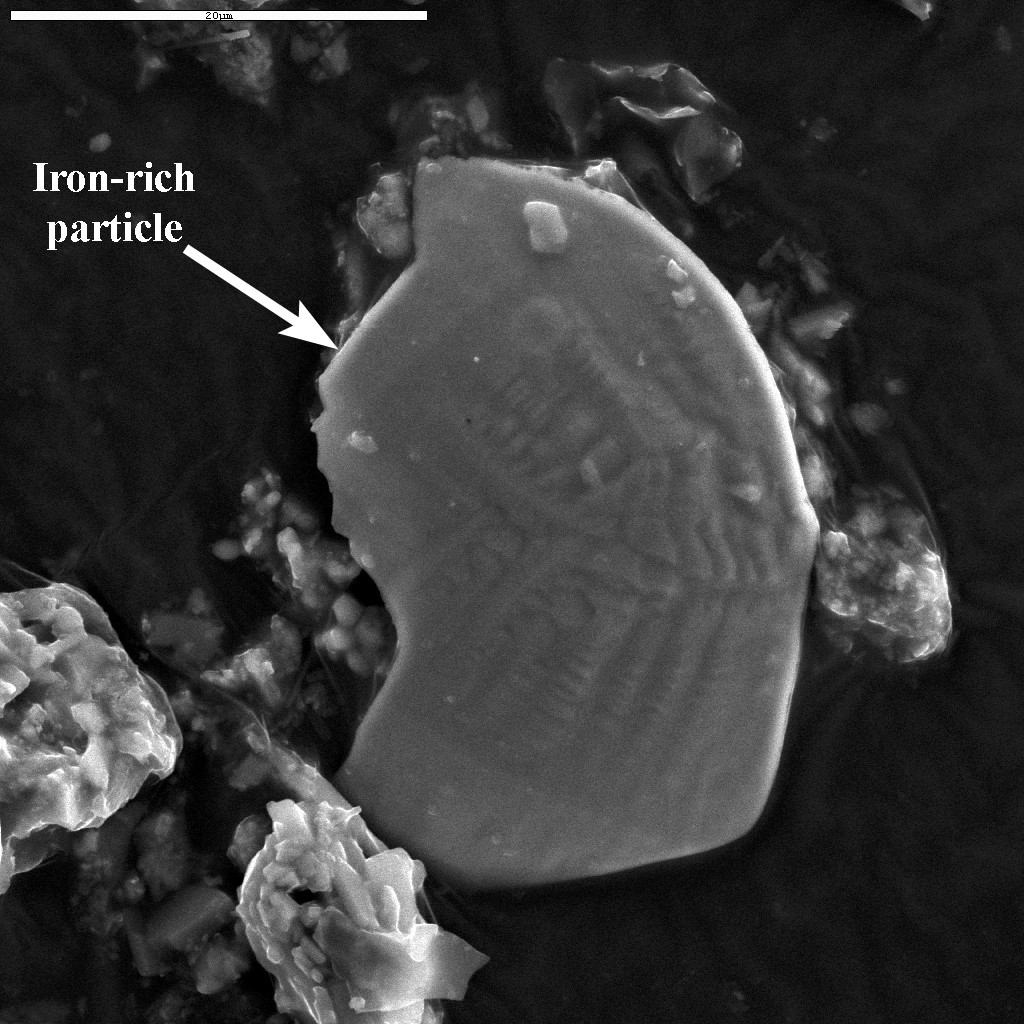
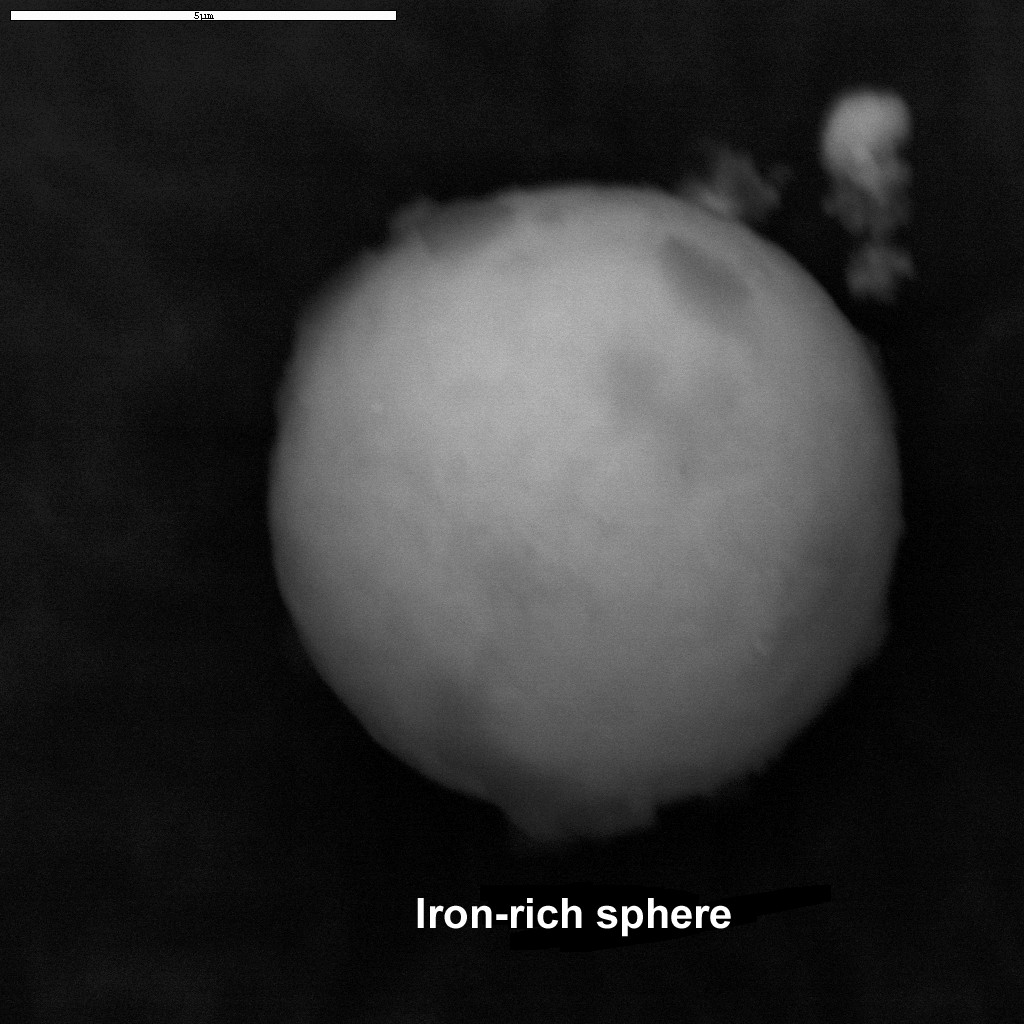
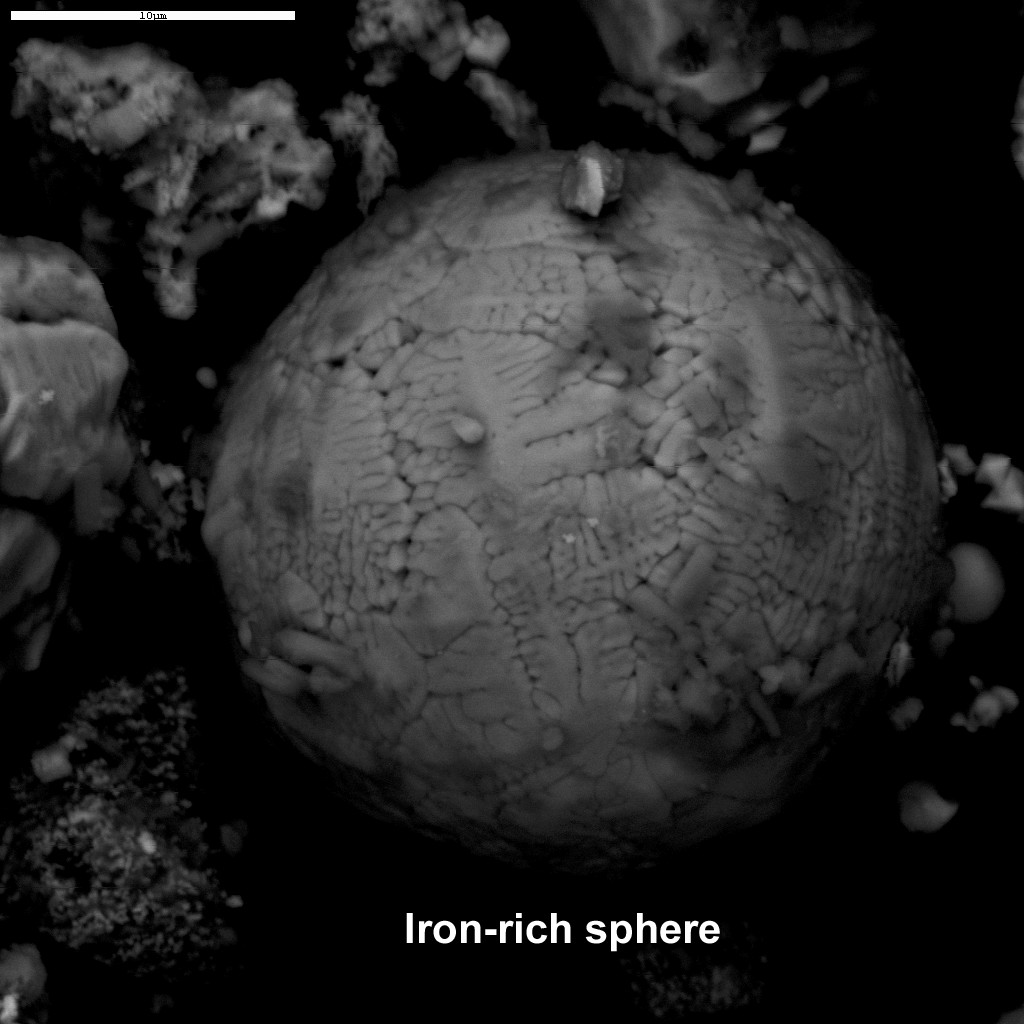
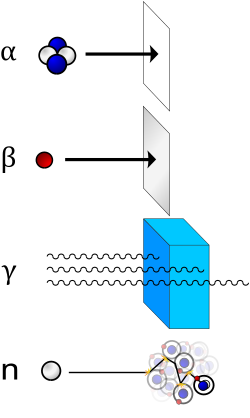