
Seismic
Reuters: “Gary Gibson, senior seismologist at Australia’s Seismology Research Centre, said a 4.2 magnitude quake would be the result of a one kiloton explosion.”
http://www.dickdestiny.com/blog/2006/10/fizzled-north-korea-bomb-test-possible.html
Decoupling
Definition
In the underground nuclear testing (the testing of nuclear weapons), decoupling refers to the attempt to prevent some of the bomb’s energy from transmitting as seismic waves. This makes it more difficult for outside observers to estimate the nuclear yield of the weapon being tested.
http://en.wikipedia.org/wiki/Decoupling
“I am still puzzled as to why the possibility of a decoupling cavern has been totally ignored.
Some of the early reports were that the test was conducted in abandoned mines, which would have a network of tunnels and shafts that I would expect could serve to decouple the blast.“
”… even a 1 kiloton explosive would still be a terrifying weapon. Recall that the 1995 Oklahoma City explosion involved only a few tons of ANFO. A 1 kiloton (1,000 ton TNT equivalent) bomb could kill people in an area of about one square mile and would partially destroy a much larger area. Most of these deaths would be from fire or from the prompt nuclear radiation.”
“A fizzle is simply a detonation of lower yield than designed. It does not mean a dud. Wrong words leads to wrong thinking.
The 1/2 kiloton NK fizzle would kill with immediate radiation over a 2 square kilometer area.
The area in the red ring in this image of Manhattan is the >500 REM lethal zone. The yellow arrows show the World Trade Center for scale purposes:”

http://www.armscontrolwonk.com/1262/garwin-and-von-hippel-on-nk-nuclear-test
Seismic and decoupling
South Korean authorities said they monitored a seismic event of 3.6 on the Richter scale that was not a natural occurrence and corresponded in time to the claimed test.
A yield of 550-800 tons (.55-.8 KT) is not too small by any means as an achievable yield.
It’s also worth pointing out that an atomic bomb of .6KT or so is no city flattener, but would work quite spectacuarly as a terrorist weapon. If detonated on the ground or from the top of a building, it would also result in serious fallout, increasing the terror effect and the number of deaths. Further, it would contaminate the terrain at and near ground zero for a long time. Cleanup and decontamination would be lengthy and very expensive. Imagine such a weapon being detonated in an American harbor.
[..]
Calculating yield from body wave
DefenseTech explains how yields are calculated from seismic readings:
You’re thinking, 3.6, 4.2, in that neighborhood. Seismic scales, like the Richter, are logarithmic, so that neighborhood can be pretty big.
But even at 4.2, the test was probably a dud.
Estimating the yield is tricky business, because it depends on the geology of the test site. The South Koreans called the yield half a kiloton (550 tons), which is more or less — a factor of two — consistent with the relationship for tests in that yield range at the Soviet Shagan test site:
Mb = 4.262 + .973LogW
Where Mb is the magnitude of the body wave, and W is the yield.
3.58-3.7 gives you a couple hundred tons (not kilotons), which is pretty close in this business unless you’re really math positive. The same equation, given the US estimate of 4.2, yields (pun intended) around a kiloton.
——————
Using the US Geological Survey figure of 4.2 magnitude body wave of the seismic shock, giving a 1 KT achieved yield, actually buttresses the case that this test was not a fizzle, in my view. For battlefield purposes, say, against the South Korean or US forces on the peninsula, a 1 KT device is more usable than a 20 KT bomb. A 1 KT weapon is smaller, thus easier to conceal, and can be designed to be fired from existing artillery pieces, whether cannons or rockets. A Nagasaki-yield weapon would be of little military utility in fighting against South Korea or American forces. And you much more easily can get from a tested 0.6-1.0 KT proof-of-concept device to a usable terror weapon of the same yield, than from a test of a much larger yielding device.
http://www.donaldsensing.com/index.php/2006/10/09/dont-jeer-at-nk-nuke-test/ (DEAD URL)
http://www.defensetech.org/archives/002832.html
Detecting nuclear tests
![[image]](https://apunked.files.wordpress.com/2017/02/quake_monitor_mod.jpg?w=640 "[image]")
Caption: Seismic detectors form the backbone of the nuclear monitoring system.
Seismic detectors—the same ones used to study earthquakes—form the backbone of the monitoring system. At the National Earthquake Information Center in Denver, information from about 500 seismic stations around the world is collected and analyzed, yielding information on 30,000 earthquakes a year, says Harley Benz, the U.S. Geological Survey scientist in charge of the center. But not every “event” is an earthquake, so the scientists have developed techniques to distinguish quakes from blasts. “We do this all the time in the western U.S.—there’s lots of quarry blasts, and the signal looks quite different,” Benz says.
Explosions tend to blast outwards in all directions evenly, producing a strong compression wave. Earthquakes, in contrast, are produced by rocks sliding against each other along a fault line, yielding strong shear waves. The waves travel at different speeds, with the compression wave arriving at detectors before the shear one. And if that first wave is the stronger of the two, Benz says, it suggests the event was an explosion. Other characteristics of the wave patterns, such as the frequency spectrum and how much of the wave traveled along the surface as apposed to through the bulk of the Earth, can also help distinguish blasts from quakes.
http://www.popularmechanics.com/science/earth/4199444.html
A magnitude 4 earthquake releases energy on the order of a one-kiloton nuclear explosion.
https://www.llnl.gov/news/newsreleases/2009/SF-09-08-01.html – Lawrence Livermore National Laboratory
Decoupling methods
There are several ways to fool a seismic detection system. One way is to camouflage the blast with conventional mining explosions; another method, known as “decoupling”, involves exploding the device in a large underground cavity designed so that the energy of the explosion will go to compressing the gas in the cavity instead of melting and compressing rock. A U.S. experiment in 1966 showed that decoupling could reduce the seismic signal by a factor of 70. Both decoupling and mine masking are extremely difficult to carry out in practice—but just in case, there are several other detection techniques.
The most definitive signature of a nuclear explosion is the presence of radionuclides, a collective term for the radioactive isotopes produced by a nuclear reaction. While “fallout” was most obvious when early tests were conducted above-ground, underground and underwater tests also tend to leak radiation into the atmosphere. The detection process, which looks for key indicators like the ratio of different xenon isotopes, takes several days and can’t pinpoint the exact origin of the blast. But once a signal is detected, there’s no doubt a nuclear explosion has taken place.
http://www.popularmechanics.com/science/earth/4199444.html
Decoupling in nuclear testing
Small Earthquake Near Russian Test Site Leads to U.S. Charges of Cheating on Comprehensive Nuclear Test Ban Treaty
On August 28 the Washington Times carried a lead story “Russia suspected of nuclear testing.” It was followed up the next day by the Washington Post and the New York Times, the latter with the headline “U.S. Suspects Russia set off Nuclear Test.” In the body of those and other press reports, however, the nature of event on August 16–whether it was a nuclear explosion or an earthquake at or near the Russian Arctic nuclear test site at Novaya Zemlya–was expressed as being still in doubt. [..]
[An] earthquake of magnitude 2.7 is a very small event, one that is rarely felt by anyone. In his executive summary of 1993 about the 1992 event, Ryall states that its magnitude was appropriate for a fully-decoupled 1 kiloton nuclear test. This begs the question Is fully decoupled or highly decoupled nuclear testing possible at Novaya Zemlya? In a 1996 review paper on decoupled nuclear testing I argued that large decoupling factors could be obtained only for explosions with yields in excess of 1 kiloton when they were detonated in huge cavities constructed in salt domes. The decoupling factor is the amplitude ratio of a well-coupled, non-evasive explosion to that of one of the same yield detonated so as to decouple or muffle the size of its seismic waves. Large cavities constructed in hard rock and used for clandestine nuclear tests are likely to leak bomb-produced radioactive isotopes to the surface by way of joints and faults. Hard rock contains such imperfections on a scale of meters and larger. A cavity with a radius of about 28 meters and at a depth of 1 km in salt is needed to fully decouple a 1 kiloton nuclear explosion. […]
A few kilotons tested with a decoupling factor of 70 times corresponds to an mb of about 3.0. A capability better than that is being achieved now for Novaya Zemlya. Probably decoupling factors no larger than a factor of two, however, are possible at that test site for yields of a few kilotons. An explosion of that size would correspond to mb 4.0.
http://www.fas.org/faspir/pir1197.htm

Img: http://www.geology110.com/images/seismicdrawing1.jpg
URL: http://www.geology110.com/seismic.html

Img: http://www.geology110.com/images/seismicwaves2.jpg URL: http://www.geology110.com/seismic.html
Seismic recordings of the World Trade Center collapses

Img: http://www.geology110.com/images/wtc3tn.jpg URL: http://www.geology110.com/seismic.html
On September 11, 2001 Columbia University’s Lamont-Doherty Earth Observatory recorded seismic signals produced by the impact of the two aircraft hitting the Twin Towers of the World Trade Center. The ground shaking was consistent with the energy released by small earthquakes, however, it was not sufficient to cause the collapse and damage to the surrounding buildings. The buildings around the Twin Towers were damaged by the kinetic energy of the falling debris and the pressure exerted on them by the debris and particle laden blast produced during the collapse of the two towers. Learn More at the Earth Institute at Columbia University.
Seismographic recordings of the tower collapses were recorded in five states, as far away as 428 kilometers [266 miles] in Lisbon, New Hampshire. Lamont’s home station, in Palisades, New York, is located above the Hudson River, 34 kilometers [21 miles] from downtown Manhattan, where the towers stood. The aircraft impacts registered local magnitude (ML) 0.9 and 0.7, indicating minimal earth shaking as a result. The subsequent collapse of the towers, on the contrary, registered magnitudes of 2.1 and 2.3, comparable to the small earthquake that occurred beneath the east side of Manhattan on January 17, 2001. Source: November 20, 2001, issue of Eos, published by the American Geophysical Union, seismologists from Columbia’s Lamont-Doherty Earth Observatory
http://www.geology110.com/seismic.html
![[image]](https://apunked.files.wordpress.com/2017/02/kim-wtc-1_mod2_border.jpg?w=640 "[image]")
Img: http://guardian.150m.com/wtc/seismic/kim-wtc-1.jpg URL: http://guardian.150m.com/wtc/seismic/small/WTC_LDEO_KIM.htm
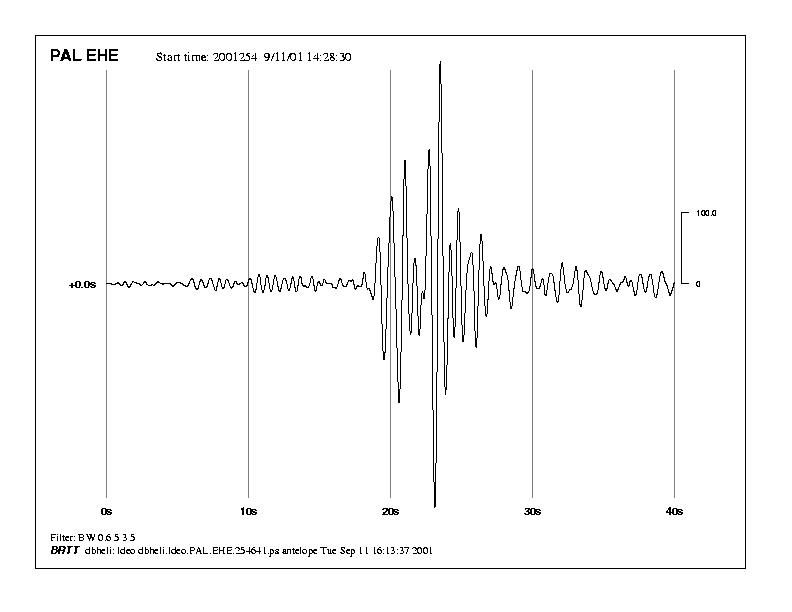
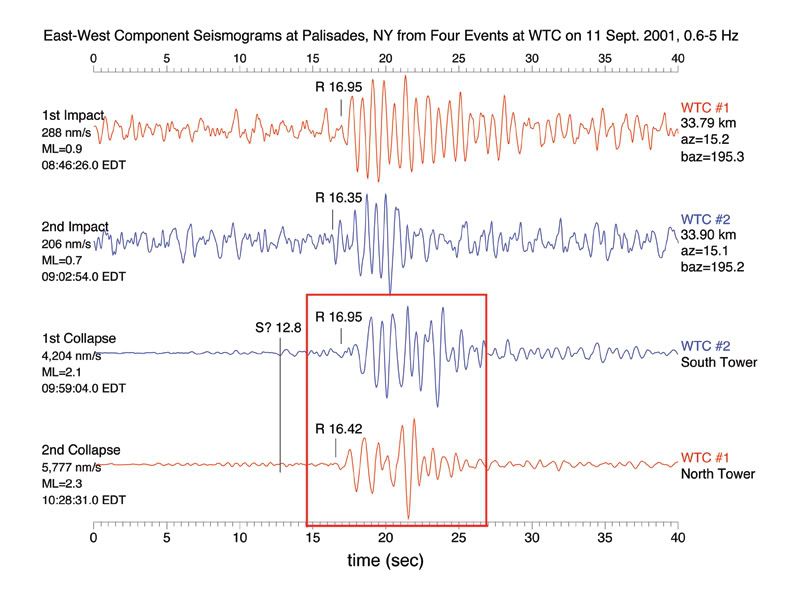
Caption: Figure 1: Seismic recordings on E-W component at Palisades for events at World Trade Center (WTC) on September 11, distance 34 km. Three hours of continuous data shown starting at 08:40EDT (12:40 UTC). Data were sampled at 40 times/s and passband filtered from 0.6 to 5 Hz. The two largest signals were generated by collapses of Towers 1 and 2. Eastern Daylight Time (EDT) is UTC minus 4 hours. Expanded views of first impact and first collapse shown in red.
Seismographic recordings of the tower collapses were recorded in five states, as far away as 428 kilometers [266 miles] in Lisbon, New Hampshire. Lamont’s home station, in Palisades, New York, is located above the Hudson River, 34 kilometers [21 miles] from downtown Manhattan, where the towers stood. The aircraft impacts registered local magnitude (ML) 0.9 and 0.7, indicating minimal earth shaking as a result. The subsequent collapse of the towers, on the contrary, registered magnitudes of 2.1 and 2.3, comparable to the small earthquake that occurred beneath the east side of Manhattan on January 17, 2001.
The Lamont seismographs established the following timeline: 8:46:26 a.m. EDT [1240 UTC] Aircraft impact – north tower, Magnitude 0.9; 9:02:54 a.m. EDT [1302 UTC] Aircraft impact – south tower, Magnitude 0.7; 9:59:04 a.m. EDT [1359 UTC] Collapse – south tower, Magnitude 2.1; 10:28:31 a.m. EDT [1428 UTC] Collapse – north tower, Magnitude 2.3.
In addition, the seismic waves were short-period surface waves, meaning they traveled within the upper few kilometers of the Earth’s crust. [..]
The paper by Won-Young Kim, Lynn R. Sykes, J.H. Armitage, J.K. Xie, Klaus H. Jacob, Paul G. Richards, M. West, F. Waldhauser, J. Armbruster, L. Seeber, W.X. Du, and Arthur Lerner-Lam, “Seismic Waves Generated by Aircraft Impacts and Building Collapses at World Trade Center, New York City,” appears in Eos, Volume 82, number 47 (20 November 2001), page 565.
http://www.earthinstitute.columbia.edu/news/story11_16_01.html
Korean Nuclear Test 10-9-06: seismic record
![]()
IMG: http://www.geology110.com/images/nuclear2b.jpg URL: http://www.geology110.com/seismic.html
Seismic activity is used to estimate suspected atomic weapon’s yield, or destructive power. The activity measured 4.2 on the Richter scale, as recorded by USGS. Initial reports regarding this event were mixed. Russian authorities said the test was equivalent to 5,000 to 15,000 tons of TNT (5-15 kilotons). The bomb dropped on Hiroshima, Japan in August 1945 had a yield of approximately 15 kilotons. “We have no doubts that it (the test) was nuclear,” Russian Defense Minister Sergei Ivanov said.
http://www.geology110.com/seismic.html
Comparison of World Trade Center collapse signals with signals from earthquakes, gas explosion and mine collapse
The signals at PAL from Collapse 2 and a small felt earthquake beneath the east side of Manhattan on January 17, 2001 are of comparable amplitude and ML (Fig. 4). The character of the two seismograms, however, is quite different. Clear P and S waves are seen only for the earthquake. The 7-km depth of the earthquake suppressed the excitation of short- period Rg, which is so prominent for the collapse. The difference in the excitation of higher frequencies also can be attributed to the short time duration of slip in small earthquakes compared to the combined source time of several seconds of the complex system of the towers and foundations responding to the impacts and collapses. The waves from the WTC events resemble those recorded by regional stations from the collapse of part of a salt mine in western New York on March 12, 1994 (ML 3.6). That source also lasted longer than that of a small earthquake. A truck bomb at the WTC in 1993, in which approximately 0.5 tons of explosive were detonated, was not detected seismically, even at a station only 16 km away.
An explosion at a gasoline tank farm near Newark NJ on January 7, 1983 generated observable P and S waves and short-period Rg waves (ML 3) at PAL. Its Rg is comparable to that for WTC collapse 2. Similar arrivals were seen at station AMNH in Manhattan, which is no longer operating, at a distance of 15 km. AMNH also recorded a prominent seismic arrival at the time expected for an atmospheric acoustic wave. [..] [The] seismic waves excited by impacts and collapses at the WTC are short-period surface waves, i.e. seismic waves traveling within the upper few kilometers of the crust.
http://guardian.150m.com/wtc/seismic/small/WTC_LDEO_KIM.htm
Authors Won-Young Kim, L. R. Sykes, J. H. Armitage, J. K. Xie, K. H. Jacob, P. G. Richards, M. West, F. Waldhauser, J. Armbruster, L. Seeber, W. X. Du and A. Lerner-Lam, Lamont-Doherty Earth Observatory of Columbia University, Palisades, N.Y. 10964, USA; also Dept. Earth and Environmental Sciences, Columbia University.
The above is an html-version of the following pdf-document:
http://www.ldeo.columbia.edu/LCSN/Eq/20010911_WTC/WTC_LDEO_KIM.pdf
Differences between seismographs of nuclear explosions and earthquakes
The earthquake source differs appreciably from that of an explosion in that the former involves shearing motion along a fault. Consequently, earthquakes typically generate larger shear (S) waves than explosions when the two sources are normalized by the size of the compressional first-arriving (P) waves.
http://www.fas.org/faspir/pir1197.htm
Advances in Monitoring Nuclear Weapon Testing – 2009 report
Detecting a test of a nuclear weapon has become so effective and reliable that no nation could expect to get away with secretly exploding a device having military significance.
Seismic monitoring can now detect a nuclear explosion with a yield of a kiloton or more anywhere on Earth. In many places, detection is far more sensitive than that.
http://www.scientificamerican.com/article.cfm?id=advances-in-monitoring-nuclear – By Paul G. Richards and Won-Young Kim (March 2, 2009)
How do scientists determine if a nuclear blast has occurred? By Julia Layton
Another method of detecting a nuclear blast is by seismograph, the device that monitors Earth tremors to pinpoint and analyze earthquake activity (among other ground-shaking events). There’s actually a whole network of 500 seismograph stations positioned around the world whose job is to report ground-shaking incidents, and that includes any evidence of bomb blasts. NPR’s “Detecting Underground Nuclear Blasts” reports that the seismic activity recorded on Monday indicated a ground disturbance that would be the equivalent of a 4.2 magnitude earthquake. That magnitude indicates a blast with about a 1-kiloton yield, which is equal to the power of 1,000 tons of TNT.
Figuring out if a seismic event is an earthquake or a bomb blast is relatively easy. Scientists perform analyses of wave patterns that can accurately confirm an earthquake-versus-explosion determination. In highly simplified terms, in an earthquake, the ground starts shaking slowly as plates slide against each other, and then the seismic activity slow picks up as the ground really starts to move. In an explosion scenario, the initial blast is extremely powerful, and the subsequent shaking of the ground grows progressively less severe. But figuring out it’s a blast and not an earthquake is only part of the process; seismographs can’t really determine if the blast was nuclear or conventional in nature. Also, it’s possible to “hide” a nuclear blast, for instance by detonating it in a tremendous underground cavity, which decreases the effects on the ground because the blast’s energy goes into compressing all that gas in the huge hole.
http://science.howstuffworks.com/nuclear-detection.htm
Detecting Underground Nuclear Blasts – by David Kestenbaum
Earthquake monitors around the world picked up vibrations from North Korea’s nuclear test range, but those signals alone are not enough to prove that it was a nuclear blast. […]
A large underground explosion generates a shock wave that travels great distances through the Earth. Seismic detectors register the vibrations. The U.S. Geological Survey says the explosion they recorded Monday was the equivalent of a 4.2 magnitude earthquake. Assuming the test took place in rock, this would translate into an explosion equivalent to roughly one kiloton, or 1,000 tons of TNT. For comparison, the “Little Boy” bomb dropped on Hiroshima in 1945 exploded with an energy of about 13 kilotons. In 1952 “Mike” — the first hydrogen bomb — created a blast of more than 10 megatons, 1,000 times more powerful.
http://www.npr.org/templates/story/story.php?storyId=6248725 – NPR October 11 2006
Indian nuclear tests and seismic signature
![[image]](https://apunked.files.wordpress.com/2017/02/walter2_border.gif?w=640 "[image]")
Img: https://www.llnl.gov/str/gifs/Walter2.gif URL: https://www.llnl.gov/str/Walter.html
As part of DOE’s effort, teams at Livermore and Los Alamost have been working to improve ways to seismically characterize clandestine underground nuclear explosions and differentiate them from other sources of seismicity, such as earthquakes and mining explosions. Much of Livermore’s work has centered on developing regional discriminants, which are characteristic features of a seismic waveform (for example, the peak amplitude at a particular frequency, within a specific time frame) recorded at distances less than 2,000 kilometers away. These discriminants are used to differentiate between explosions and other types of seismic sources. [..]
As seen in Figure 2, the seismogram from a representative earthquake clearly differs from that of the May 11 test. Livermore-refined discriminants based on P and S waves were strongly indicative of an explosion, not an earthquake or other seismic source, at all frequencies tested (0.5 to 8 hertz). Livermore seismologist Bill Walter explains that the differences in seismic P- and S-wave energy provide one method of discriminating explosions from earthquakes. Seismic P waves are compressional waves, similar to sound waves in the air. Shear (S) waves are transverse waves, like those that propagate along a rope when one end is shaken. Because underground explosions are spherically symmetric disturbances, they radiate seismic P waves efficiently. In contrast, earthquakes result from sliding or rupture along a buried fault surface and strongly excite the transverse motions of S waves. Thus, we expect that explosions will show strong P waves and weak S waves and that earthquakes will show weak P waves and strong S waves, as seen in Figure 2.
According to Walter, one way to quantify this difference is by determining the ratio of P-wave to S-wave energy measured from the seismograms. Explosions should have higher P/S ratios than earthquakes.
https://www.llnl.gov/str/Walter.html
The seismograph of theWorld Trade Center tower collapses compared with the seismograph of nuclear test
![[image]](https://apunked.files.wordpress.com/2017/02/kim-wtc-1_mod3_border2.jpg?w=640 "[image]")

Img: http://guardian.150m.com/wtc/seismic/small/kim-wtc-1.jpg URL: http://guardian.150m.com/wtc/seismic/small/WTC_LDEO_KIM.htm
Img: https://www.llnl.gov/str/gifs/Walter2.gif URL: https://www.llnl.gov/str/Walter.html
![[image]](https://apunked.files.wordpress.com/2017/02/nuke-test-vs-earthquake_border.jpg?w=640 "[image]")
Img: http://www.unitedstatesaction.com/Nuke-Test-vs-Earthquake.jpg URL: http://www.unitedstatesaction.com/nuclear-seismic-studies.htm Source: Science and Technology Review Dec 1998 http://www.llnl.gov/str/pdfs/09_98.pdf
![[image]](https://apunked.files.wordpress.com/2017/02/seismic-nuke-vs-earthquake_border.jpg?w=640 "[image]")
Img: http://www.unitedstatesaction.com/Seismic-Nuke-vs-Earthquake.jpg URL: http://www.unitedstatesaction.com/nuclear-seismic-studies.htm Source: http://www.calit2.net/index.php Distributed Seismic and Radionuclide Sensor Network
South Tower collapse and North Korean nuclear test
![[image]](https://apunked.files.wordpress.com/2017/02/kim-wtc-1_mod4_border.jpg?w=640 "[image]")
Img: http://guardian.150m.com/wtc/seismic/small/kim-wtc-1.jpg URL: http://guardian.150m.com/wtc/seismic/small/WTC_LDEO_KIM.htm
![[image]](https://apunked.files.wordpress.com/2017/02/kim-wtc-3_mod_border.jpg?w=640 "[image]")
Img: http://guardian.150m.com/wtc/seismic/kim-wtc-3.jpg URL: http://guardian.150m.com/wtc/seismic/small/WTC_LDEO_KIM.htm
Caption: Figure 3: Record section of vertical-component seismograms from stations in Fig. 2 following collapse of north Tower of WTC. Zero corresponds to computed origin time of 10:28:31 EDT. Data filtered for passband 0.5 to 10 Hz. Three velocities indicated by dotted lines.
![[image]](https://apunked.files.wordpress.com/2017/02/kim-wtc-3_mod2_border.jpg?w=640 "[image]")
Img: http://guardian.150m.com/wtc/seismic/kim-wtc-3.jpg URL: http://guardian.150m.com/wtc/seismic/small/WTC_LDEO_KIM.htm Caption: Figure 3: Record section of vertical-component seismograms from stations in Fig. 2 following collapse of north Tower of WTC. Zero corresponds to computed origin time of 10:28:31 EDT. Data filtered for passband 0.5 to 10 Hz. Three velocities indicated by dotted lines.
Audio of roar from “9/11 Eyewitness” video
VIDEO: Rick Siegel 9-11 Eyewitness-Booming sounds Dailymotion
This is a segment from Rick Siegel’s video “9/11 Eyewitness”. Audio that showed booming sounds before the collapse of the North Tower. The booming sounds accord with the seismic record of the North Tower’s destruction. Segment starts at 1:36:30 in complete video.

Still from the video: it shows the booming sounds occur before the North Tower starts to fall.
Complete video: “9/11 Eyewitness”
VIDEO: Rick Siegel 9 11 Eyewitness Video ArchiveOrg
Rick Siegel’s “9/11 Eyewitness” – full length film is 1h44m long.

Modified – cropped image from http://graphics8.nytimes.com/images/2009/05/26/world/26threat.600.jpg URL: http://www.nytimes.com/2009/05/26/world/asia/26threat.html – NY Times: Seismic Readings Point to a Small Nuclear Test (May 25, 2009)
Caption: Seismograph of North Korean nuclear test.

Img: http://graphics8.nytimes.com/images/2009/05/26/world/26threat.600.jpg URL: http://www.nytimes.com/2009/05/26/world/asia/26threat.html – NY Times: Seismic Readings Point to a Small Nuclear Test (May 25, 2009)
Report: Initial seismic readings from the underground blast in North Korea were consistent with a relatively small nuclear test, but it will be days or weeks before the United States and international organizations can determine whether it was a nuclear detonation and how successful it might have been, experts said Monday. [..]
Martin B. Kalinowski, a nuclear expert at the University of Hamburg, said a magnitude of 4.7 corresponded to a nuclear explosive yield of about three to eight kilotons of high explosives, with the most likely yield being four kilotons. A blast that generated a tremor with a magnitude of 4.5 would be smaller.
In contrast, the primitive bombs dropped on Hiroshima and Nagasaki had explosive yields of 15 kilotons and 22 kilotons, respectively.
A senior Obama administration official said Monday afternoon that based on seismic data alone, officials estimated the explosion at “several kilotons.”
Img: http://guardian.150m.com/wtc/seismic/small/kim-wtc-1.jpg URL: http://guardian.150m.com/wtc/seismic/small/WTC_LDEO_KIM.htm Caption: Collapse of South Tower
![[image]](https://apunked.files.wordpress.com/2017/02/131n_aaf9_60s_mod_border.jpg?w=640 "[image]")
Img: http://eqinfo.ucsd.edu/special_events/nuclear_tests/images/131N_AAf9_60s.jpeg URL: http://eqinfo.ucsd.edu/special_events/nuclear_tests/comparison.php
Ground-shaking insignificant in Twin Tower collapses
“During the collapse, most of the energy of the falling debris was absorbed by the towers and the neighboring structures, converting them into rubble and dust or causing other damage — but not causing significant ground shaking.” — Dr. Arthur Lerner-Lam, Director of Columbia University’s Center for Hazards and Risk Research, as quoted in Earth Institute News http://www.earthinstitute.columbia.edu/news/story11_16_01.html
More discussion at http://assassinationscience.com/wtc.html
Plane impacts probably involved explosions
![[image]](https://apunked.files.wordpress.com/2017/02/kim-wtc-1_mod5_border.jpg?w=640 "[image]")
Modified Img:http://guardian.150m.com/wtc/seismic/kim-wtc-1.jpg URL: http://guardian.150m.com/wtc/seismic/small/WTC_LDEO_KIM.htm
Modified – cropped image from http://graphics8.nytimes.com/images/2009/05/26/world/26threat.600.jpg URL: http://www.nytimes.com/2009/05/26/world/asia/26threat.html – NY Times: Seismic Readings Point to a Small Nuclear Test (May 25, 2009)
Img: http://eqinfo.ucsd.edu/special_events/nuclear_tests/images/131N_AAf9_60s.jpeg URL: http://eqinfo.ucsd.edu/special_events/nuclear_tests/comparison.php
Comparisons with other nuclear events

Img: http://www.reformation.org/seismic-waves2.jpg URL: http://www.reformation.org/ground-zero.html (Ground Zero-The Nuclear Demolition of the Twin Towers – Copyright © 2007 by Niall Kilkenny) Caption: Onset of P waves from a Soviet underground nuclear test monitored at a relay station in England.
![[image]](https://apunked.files.wordpress.com/2017/02/seismic-waves4_border.jpg?w=640 "[image]")
Img: http://www.reformation.org/seismic-waves4.jpg URL: http://www.reformation.org/ground-zero.html Caption: Seismic signature from the North Tower nuclear explosion.
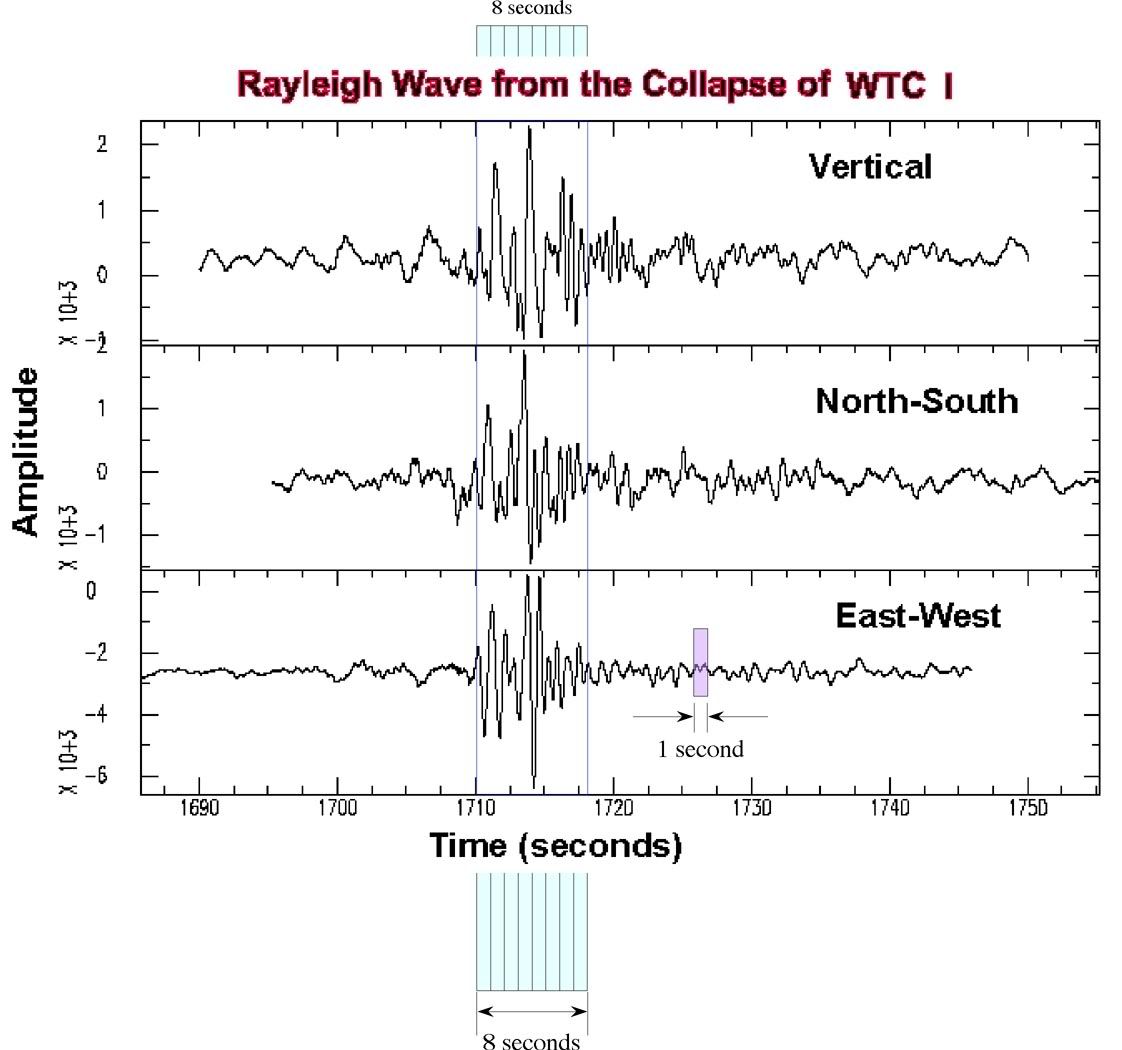
Reversed Rayleigh Waves
![[image]](https://apunked.files.wordpress.com/2017/02/rayleighreversed_mod_border.jpg?w=640 "[image]")
Image: http://www.iris.edu/hq/gallery/d/4195-2/one-pager-fig.jpg URL: http://www.iris.edu/hq/gallery/photo/4193 Caption: Interestingly, the observed Rayleigh waves are reversed, consistent with an implosion rather than an explosion source.
TEXT:
The last underground nuclear tests were conducted by India and Pakistan in May, 1998. [..] The IRIS station NIL (Nilore, Pakistan) is close to a planned IMS primary station and recorded some very interesting seismograms from the May 18, 1998, Indian test. We carefully calibrated the path to NIL using a prior Mw 4.4 earthquake that occurred on April 4, 1995, about 110 km north of the Indian test site. [..] Interestingly, the observed Rayleigh waves are reversed, consistent with an implosion rather than an explosion source. The preferred explanation is that the explosion released tectonic stress near the source region, which can be modeled as a thrust earthquake of approximate Mw 4.0 earthquake plus a pure explosion. This tectonic release is sufficient to completely dominate the Rayleigh waves and produce the observed signal (Walter et al., 2005). We also examined the explosion at high frequencies of 6-8 Hz where many studies have shown that relative P/S amplitudes can discriminate explosions from a background of earthquakes (Rodgers and Walter, 2002). Comparing with the April 4 1995 earthquake we see the classic difference of relatively large P/S values for the explosion compared to the earthquakes despite the complication of the large tectonic release during the explosion. (This is LLNL report UCRL-TR-211315).
Rodgers, A. J. and W. R. Walter, Seismic discrimination of the May 11, 1998 Indian nuclear test with short-period regional data from station NIL (Nilore, Pakistan), Pure Appl. Geophys., 159, 679-700, 2002.
Walter, W. R., D. Bowers, N. Selby, A. Rodgers and D. Porter, Tectonic Release from the May 11, 1998 Indian Nuclear Tests, LLNL report UCRL-JRNL-202983-DRAFT (to be submitted in 2005).
Date Taken: January 29, 2009
Photographer / Contributor: William R. Walter, Arthur J. Rodgers • Lawrence Livermore National Laboratory; David Bowers, Neil Selby • Blacknest, United Kingdom
![[image]](https://apunked.files.wordpress.com/2017/02/kim-wtc-3_mod4_border.jpg?w=640 "[image]")
Img: http://guardian.150m.com/wtc/seismic/kim-wtc-3.jpg URL: http://guardian.150m.com/wtc/seismic/small/WTC_LDEO_KIM.htm
Caption: Record section of vertical-component seismograms from stations in Fig. 2 following collapse of north Tower of WTC. Zero corresponds to computed origin time of 10:28:31 EDT. Data filtered for passband 0.5 to 10 Hz. Three velocities indicated by dotted lines.
![[image]](https://apunked.files.wordpress.com/2017/02/composite_seismic_border.jpg?w=640 "[image]")
![[image]](https://apunked.files.wordpress.com/2017/02/composite2_border.jpg?w=640 "[image]")
Image: http://www.iris.edu/hq/gallery/d/4195-2/one-pager-fig.jpg URL: http://www.iris.edu/hq/gallery/photo/4193 and Image: http://img19.imageshack.us/img19/1914/wtcseismicby3.jpg URL: http://letsrollforums.com/911-world-trade-center-t16686p20.html
Comparison between North Korean test and World Trade Center Tower collapses

Img: http://i2.photobucket.com/albums/y2/mrsdudara/wtc1level.jpg URL: http://www.abovetopsecret.com/forum/thread650062/pg2
![[image]](https://apunked.files.wordpress.com/2017/02/dprknuke_mod_border.gif?w=640 "[image]")
Img: http://i2.photobucket.com/albums/y2/mrsdudara/dprknuke.gif URL: http://www.abovetopsecret.com/forum/thread650062/pg2
Caption: DPRK’s seismic signature of their nuclear test

Img: http://www.globalsecurity.org/wmd/library/news/dprk/2006/dprk-061010-ceme-gs-ras01-01-s.gif URL: http://www.globalsecurity.org/wmd/world/dprk/nuke-test-1.htm
Caption: Seismic record of explosion from digital station Vladivostok
Source: CEME – Geophysical Service of Russian Academy.
TEXT: On October 9, 2006, North Korea’s Korean Central News Agency announced that it had successfully conducted an underground nuclear test. The test was reported to have taken place at 10:36AM, local time, in Hwaderi, near Kilju city, in North Hamkyung province. According to the KCNA statement, no radioactive leakage had taken place as a consequence of the test. [..]
The nuclear test was reported to have had a yield equivalent to between 500 and 2000 tons of TNT. By 15 October 2006 US intelligence estimates of the test put the size of the blast as low as 0.2 kilotons, the equivalent of 200 tons of TNT. According to some reports, the North Koreans had informed the Chinese government that the planned test would produce a 4-kiloton explosion.
Strange anomaly noted in World Trade Center collapses

Img: http://img19.imageshack.us/img19/1914/wtcseismicby3.jpg URL: http://letsrollforums.com/911-world-trade-center-t16686p20.html
Caption: These unexplained “spikes” in the seismic data lend credence to the theory that massive explosions at the base of the towers caused the collapses [..] A “sharp spike of short duration” is how seismologist Thorne Lay of University of California at Santa Cruz told AFP an underground nuclear explosion appears on a seismograph [..] Experts cannot explain why the seismic waves peaked before the towers actually hit the ground.
TEXT:
The Palisades seismic data recorded a 2.1 magnitude earthquake during the 10-second collapse of the South Tower at 9:59:04 and a 2.3 quake during the 8-second collapse of the North Tower at 10:28:31.
However, the Palisades seismic record shows that—as the collapses began—a huge seismic “spike” marked the moment the greatest energy went into the ground. The strongest jolts were all registered at the beginning of the collapses, well before the falling debris struck the Earth.
These unexplained “spikes” in the seismic data lend credence to the theory that massive explosions at the base of the towers caused the collapses.
A “sharp spike of short duration” is how seismologist Thorne Lay of University of California at Santa Cruz told AFP an underground nuclear explosion appears on a seismograph.
The two unexplained spikes are more than 20 times the amplitude of the other seismic waves associated with the collapses and occurred in the East-West seismic recording as the buildings began to fall.
Experts cannot explain why the seismic waves peaked before the towers actually hit the ground.
Asked about these spikes, seismologist Arthur Lerner-Lam, director of Columbia University’s Center for Hazards and Risk Research told AFP, “This is an element of current research and discussion. It is still being investigated.”
Lerner-Lam told AFP that a 10-fold increase in wave amplitude indicates a 100-fold increase in energy released. These “short-period surface waves,” reflect “the interaction between the ground and the building foundation,” according to a report from Columbia Earth Institute.
“The seismic effects of the collapses are comparable to the explosions at a gasoline tank farm near Newark on Jan. 7, 1983,” the Palisades Seismology Group reported on Sept. 14, 2001.
One of the seismologists, Won-Young Kim, told AFP that the Palisades seismographs register daily underground explosions from a quarry 20 miles away.
These blasts are caused by 80,000 pounds of ammonium nitrate and cause local earthquakes between Magnitude 1 and 2. Kim said the 1993 truck-bomb at the WTC did not register on the seismographs because it was “not coupled” to the ground.
“Only a small fraction of the energy from the collapsing towers was converted into ground motion,” Lerner-Lam said. “The ground shaking that resulted from the collapse of the towers was extremely small.”
http://web.archive.org/web/20020905195530/http://www.americanfreepress.net/09_03_02/NEW_SEISMIC_/new_seismic_.html – American Free Press: New Seismic Data Refutes Official Explanation By Christopher Bollyn (Sept. 3, 2002)
Other graphs of seismic disturbances at the World Trade Center
![[image]](https://apunked.files.wordpress.com/2017/02/graph2-lg_mod_border.jpg?w=640 "[image]")
http://i18.photobucket.com/albums/b108/janedoe444/graph2-lg.jpg URL: http://janedoe0911.tripod.com/Shake.html
![[image]](https://apunked.files.wordpress.com/2017/02/seismicvne_mod_border.jpg?w=640 "[image]")
http://i18.photobucket.com/albums/b108/janedoe444/911/seismicVNE.jpg URL: http://janedoe0911.tripod.com/Shake.html
Other seismographs of Twin Tower Collapses
![[image]](https://apunked.files.wordpress.com/2017/02/seismic_collapse_103_mod_border.gif?w=640 "[image]")
Img: http://www.911myths.com/assets/images/seismic_collapse_103.gif URL: http://www.911myths.com/html/seismic_record.html Caption: 1st collapse south tower
![[image]](https://apunked.files.wordpress.com/2017/02/seismic_collapse_2_mod_border.gif?w=640 "[image]")
Img: http://www.911myths.com/assets/images/seismic_collapse_2.gif URL: http://www.911myths.com/html/seismic_record.html
Distinguishing nuclear explosions from other events
Distinguishing an earthquake from a nuclear event requires a close examination of the seismic waves. Such waves fall into two major categories: surface waves, which move along Earth’s surface, and body waves, which move through Earth and bounce off structures inside. Body waves may be primary (P) or secondary (S). Seismic P waves are compressional waves, similar to sound waves in the air. S waves are shear, or transverse, waves, similar to those that propagate along a rope when one end is shaken. Underground explosions radiate P waves in a relatively symmetric spherical shape. Earthquakes, which result from plates sliding along a buried fault, strongly excite the transverse motions of S waves, producing a distinct radiation pattern. Explosions thus show strong P waves and weak S waves. Earthquakes, in contrast, typically show weak P waves and strong S waves.
![[image]](https://apunked.files.wordpress.com/2017/02/walter1_border.jpg?w=640 "[image]")
Img: https://str.llnl.gov/Mar09/images/walter1.jpg URL: https://str.llnl.gov/Mar09/walter.html Caption: Various kinds of seismic events can be grouped on a source-type, or Hudson, plot based on their ground motion. A perfectly symmetric underground explosion would appear at the apex of the plot. By analyzing the seismic waves produced by the disturbance that rocked the Crandall Canyon Mine in Utah in August 2007, Laboratory seismologists determined that the event was an implosive tunnel collapse, not the sideways slippage of an earthquake.
But this information alone is not foolproof because the structure of Earth imparts an imprint on the signal. One way to quantify the difference between these seismic disturbances is to determine the ratio of P-wave to S-wave energy measured from the seismograms. Explosions should have higher P:S ratios than earthquakes.
Recent Livermore work led by Walter sought to clarify the characteristics of the P:S ratios that distinguish nuclear weapons tests from other tectonic activity. By examining regional amplitude ratios of ground motion in a variety of frequencies, his team empirically demonstrated that such ratios indeed separate explosions from earthquakes. The researchers used closely located pairs of earthquakes and nuclear explosions recorded at monitoring stations at or near the Nevada Test Site; Novaya Zemlya and Semipalatinsk, former Soviet Union test sites; Lop Nor, China; India; Pakistan; and the North Korea test.
“At high frequencies, above 6 hertz, the P:S ratio method appears to work everywhere we looked,” says Walter. “Explosions have larger P:S amplitude values.” For example, a test in India on May 11, 1998, compares well with the October 9, 2006, North Korea test.
https://str.llnl.gov/Mar09/walter.html –
Bill Walter is quoted. Lawrence Livermore National Laboratory Operated by Lawrence Livermore National Security, LLC, for the U.S. Department of Energy’s National Nuclear Security Administration

Img: https://str.llnl.gov/Mar09/images/walter2.jpg URL: https://str.llnl.gov/Mar09/walter.html
Caption: Seismograms recorded during the explosion (red wave) and a recent earthquake (blue wave) near that experiment show the different seismic patterns produced by these geologic disturbances.
Differences between nuclear and earthquake seismic signatures
Differences between nuclear explosions and earthquakes
- Explosions produce strong compressional wave (P-wave). Seismic signals are depleted in S-wave.
- Earthquakes produce strong S-waves.

Explosions and earthquakes
- Explosions produce strong compressional wave (P-wave). Seismic signals are depleted in S-wave
- Earthquakes produce strong S-wave.
Img: http://docs.google.com/viewer?pid=bl&srcid=ADGEESho7069HSH3jkp0M-A7yk6VDlyeYQAzX34cnC2D9itEqzSBPlMTKB7aib0YCb5p7oA5Y1YGCFHn0E7fVd48Wkwt8IQc6JQxun3RDHYuSK17YXVNmfgoQ3Yf_TsYu1_IKMAbHzIm&q=cache%3AC1w8vCTIhu4J%3Awww.eas.slu.edu%2FPeople%2FLZhu%2Fteaching%2Feas130%2Fdetect.ppt%20nuclear%20seismic%20detect&docid=2b6961a411f5a3be01e17df2e60b0a8f&a=bi&pagenumber=12&w=800 URL: http://docs.google.com/viewer?a=v&q=cache:C1w8vCTIhu4J:www.eas.slu.edu/People/LZhu/teaching/eas130/detect.ppt+nuclear+seismic+detect&hl=en&gl=kr&pid=bl&srcid=ADGEESho7069HSH3jkp0M-A7yk6VDlyeYQAzX34cnC2D9itEqzSBPlMTKB7aib0YCb5p7oA5Y1YGCFHn0E7fVd48Wkwt8IQc6JQxun3RDHYuSK17YXVNmfgoQ3Yf_TsYu1_IKMAbHzIm&sig=AHIEtbRG6zBkNBF3_2upUM15MWSDBG8b6Q
Powerpoint: Detect and Isentify Nuclear Explosions by Lupei Zhu Fall 2004

Explosion Yield and Magnitude
The energy releases (yield Y in kt TNT) of tamped (no decoupling) underground nuclear explosions have been calibrated against their measured seismic magnitudes using some NTS tests:
mb = log Y + 4.0
Ms = log Y + 2.0
So a 1 kt explosion is equivalent to an earthquake of mb 4.0.

Differences between nuclear explosions and earthquakes
- Explosions have much smaller source dimension.
Log R (in km) = (1/3) log Y – 2
It’s ~ 1 km for a 1 Mt device. An earthquake of this size (Ms 8) usually have a dimension of 100 km.
- Explosions have shorter time duration
A Mt device has a duration of ~ 1 sec, as compared to 30 sec for a similar sized earthquake.
- So explosions generate more high-frequency signals than earthquakes.

Difference in Radiation Pattern
- Earthquakes have much more complicated radiation patterns than explosions
- Explosions tend to have nearly isotropic radiation patterns (the same in all directions) while earthquakes have many “lobes” in their patterns
- Therefore the observed radiation pattern of a source can be used as a discriminant

Comparing the seismic records of World Trade Center collapses and Indian nuclear test
More comparisons with Indian nuclear test

http://www.serendipity.li/wot/pop_mech/seismic_record.png URL: http://www.serendipity.li/wot/pop_mech/reply_to_popular_mechanics.htm Img 2: http://i190.photobucket.com/albums/z235/newbie_bucket/c6b6812d.jpg URL: http://209.157.64.200/focus/news/2629020/posts Alternate URL: http://www.metafilter.com/23239/The-Pacific-Northwest-Seismograph-Network

http://www.serendipity.li/wot/pop_mech/seismic_record.png URL: http://www.serendipity.li/wot/pop_mech/reply_to_popular_mechanics.htm Img 2: http://i190.photobucket.com/albums/z235/newbie_bucket/c6b6812d.jpg URL: http://209.157.64.200/focus/news/2629020/posts Alternate URL: http://www.metafilter.com/23239/The-Pacific-Northwest-Seismograph-Network

http://www.serendipity.li/wot/pop_mech/seismic_record.png URL: http://www.serendipity.li/wot/pop_mech/reply_to_popular_mechanics.htm Img 2: http://i190.photobucket.com/albums/z235/newbie_bucket/c6b6812d.jpg URL: http://209.157.64.200/focus/news/2629020/posts Alternate URL: http://www.metafilter.com/23239/The-Pacific-Northwest-Seismograph-Network

Img 2: http://i190.photobucket.com/albums/z235/newbie_bucket/c6b6812d.jpg URL: http://209.157.64.200/focus/news/2629020/posts Alternate URL: http://www.metafilter.com/23239/The-Pacific-Northwest-Seismograph-Network Img 2: http://www.911myths.com/assets/images/wtc_pal_ehe_500.gif URL: http://www.911myths.com/html/seismic_proof_.html

Img 2: http://i190.photobucket.com/albums/z235/newbie_bucket/c6b6812d.jpg URL: http://209.157.64.200/focus/news/2629020/posts Alternate URL: http://www.metafilter.com/23239/The-Pacific-Northwest-Seismograph-Network Image 2: http://www.911myths.com/assets/images/wtc_pal_ehe_500.gif URL: http://www.911myths.com/html/seismic_proof_.html

http://newsimg.bbc.co.uk/media/images/45825000/jpg/_45825538_nuclearseizemic_226afp.jpg URL: http://news.bbc.co.uk/2/hi/asia-pacific/6033893.stm Caption: Seismic shockwaves from the latest test were recorded in South Korea
Cavity decoupling
Cavity Decoupling. Because of the drawbacks of all of these scenarios for clandestine testing, partial or full decoupling of subterranean tests is widely viewed as the only serious threat to monitoring a test ban. Decoupling involves conducting a nuclear test so as to reduce the amplitudes of seismic waves to levels below those for a contained, tamped explosion. One less effective way to do this is to conduct the test above the water Table in a large body of dry, porous sediment. Far more effective, in principle, is testing in a large mined underground cavity.
In a tamped underground nuclear explosion, large volumes of rock are exposed to overpressures far beyond the limits of elasticity, causing them to yield and suddenly to be displaced outward a large distance, generating large and easily detected seismic waves. If the explosion takes place within a very large cavity, however, the pressure of the shock wave in the surrounding rock remains below the elastic limit and produces relatively small displacements. Some early work suggested that, with “full decoupling,” seismic amplitudes transmitted into the earth at some frequencies could be reduced by over two orders of magnitude. Later studies indicate that decoupling factors of ≈70 may be achieved at low frequencies but decoupling factors at high frequencies are likely to be much smaller. Hence, broadband seismic instruments can be extremely useful in test ban monitoring. Joints or other fractures in the surrounding rock may lead to somewhat lower decoupling factors. If the cavity is too small for full decoupling, the seismic waves are reduced by a value smaller than that for full decoupling. The effects of a nonspherical cavity can be quite complicated.
http://www.ncbi.nlm.nih.gov/pmc/articles/PMC17991/
Proc Natl Acad Sci U S A. 1999 September 28; 96(20): 11090–11095. Copyright © 1999, The National Academy of Sciences Geophysics. Geologic constraints on clandestine nuclear testing in South Asia By Dan M. Davis and Lynn R. Sykes

Decoupling
• Another way of decoupling is to fire the explosion in a large cavity.
• A factor of 120 can be achieved in theory if the cavity is large enough so that the shock-wave deformation is elastic (fully decoupled).
• A factor of 70 was achieved in one US test in which a 0.38 kt explosion was detonated in the cavity produced by a 5.3-kt explosion (see movie)

Decoupling
- To reduce seismic signal strength by firing the explosion in low-coupling medium (such as dry alluvium) or in a cavity.
- The decoupling factor is defined as the amplitude ratio of the seismic signals from a fully contained explosion in hard rock to from a decoupled explosion.
- A decoupling factor up to 10 can be achieved for dry alluvium.
- A problem is to avoid leakage of radioactive material and surface deformation. This demands thick alluvial deposit (~600 m for a 1 kt shot).
URL: http://docs.google.com/viewer?a=v&q=cache:C1w8vCTIhu4J:www.eas.slu.edu/People/LZhu/teaching/eas130/detect.ppt+nuclear+seismic+detect&hl=en&gl=kr&pid=bl&srcid=ADGEESho7069HSH3jkp0M-A7yk6VDlyeYQAzX34cnC2D9itEqzSBPlMTKB7aib0YCb5p7oA5Y1YGCFHn0E7fVd48Wkwt8IQc6JQxun3RDHYuSK17YXVNmfgoQ3Yf_TsYu1_IKMAbHzIm&sig=AHIEtbRG6zBkNBF3_2upUM15MWSDBG8b6Q (Detect and Identify Nuclear Explosions – Lupei Zhu Fall 2004)
Seismic signature

Seismic waveform nuclear vs. earthquake URL: http://www.calit2.net/technology/features/sensorNetClass/radio.pdf
Richter magnitude and TNT-equivalent seismic energy yield
| Richter Magnitude | TNT for Seismic Energy Yield | Example (approximate) |
| -1.5 | 6 ounces | Breaking a rock on a lab table |
| 1.0 | 30 pounds | Large Blast at a Construction Site |
| 1.5 | 320 pounds | Large Quarry or Mine Blast |
| 2.0 | 1 ton | |
| 2.5 | 4.6 tons | |
| 3.0 | 29 tons | |
| 3.5 | 73 tons | |
| 4.0 | 1,000 tons | Small Nuclear Weapon |
| 4.5 | 5,100 tons | Average Tornado (total energy) |
| 5.0 | 32,000 tons | |
| 5.5 | 80,000 tons | Little Skull Mtn., NV Quake, 1992 |
| 6.0 | 1 million tons | Double Spring Flat, NV Quake, 1994 |
| 6.5 | 5 million tons | Northridge, CA Quake, 1994 |
| 7.0 | 32 million tons | Hyogo-Ken Nanbu, Japan Quake, 1995; Largest Thermonuclear Weapon |
| 7.5 | 160 million tons | Landers, CA Quake, 1992 |
| 8.0 | 1 billion tons | San Francisco, CA Quake, 1906 |
| 9.0 | 32 billion tons | Chilean Quake, 1960 |
| 10.0 | 1 trillion tons | (San-Andreas type fault circling Earth) |
| 12.0 | 160 trillion tons | (Fault Earth in half through center, OR Earth’s daily receipt of solar energy) |
URL: http://www.seismo.unr.edu/ftp/pub/louie/class/100/magnitude.html
Seismic waves
![[image]](https://apunked.files.wordpress.com/2017/02/waves_border.gif?w=640 "[image]")
The mechanical properties of the rocks that seismic waves travel through quickly organize the waves into two types. Compressional waves, also known as primary or P waves, travel fastest, at speeds between 1.5 and 8 kilometers per second in the Earth’s crust. Shear waves, also known as secondary or S waves, travel more slowly, usually at 60% to 70% of the speed of P waves. P waves shake the ground in the direction they are propagating, while S waves shake perpendicularly or transverse to the direction of propagation.
URL: http://www.seismo.unr.edu/ftp/pub/louie/class/100/seismic-waves.html
Seismic detection of nuclear tests
![[image]](https://apunked.files.wordpress.com/2017/02/ll_pdf_seismic_border.jpg?w=640 "[image]")
Meeting Monitoring Challenges Zucca points out that under the current Threshold Test Ban Treaty (banning explosions exceeding 150 kilotons), determining accurate explosive yield is the critical issue. Most nuclear tests near the threshold treaty’s limit generate seismic magnitudes of about 6 or greater on the Richter scale. Seismic signals from these tests travel thousands of miles through Earth’s relatively homogeneous core and mantle and are readily picked up by far-away seismic stations for relatively straightforward characterization (Figure 2a). Under the CTBT, however, the critical issues will be to determine that a nuclear explosion no matter its size took place and to pinpoint its location accurately. A nation attempting to conceal a test could attempt to minimize the seismic signals. Such signals from a small nuclear test could be well below magnitude 4, with resulting measurable signals traveling 1,000 miles or less. What’s more, the signals would likely be confined to Earth’s upper mantle and crust, an extremely heterogeneous environment that distorts, and even blocks, parts of the signals (Figure 2b). Accurately locating and characterizing signals at these so-called regional distances pose a significant challenge, says seismologist Bill Walter. It’s a much harder job because we can’t use global models of Earth. We have to calibrate region by region, seismic station by seismic station. Successfully meeting the regional distance challenge, says seismologist Marv Denny, has been the most difficult aspect of the Livermore effort over the past several years. Denny says that complicating the task is the huge number of events that, at first cut, can resemble a small nuclear detonation. Stations will be recording a constant stream of background noise that includes earthquakes, lightning, meteors, sonic booms, navy armament testing, mining explosions, construction activities and other industrial operations, nuclear reactor operations and accidents, natural radioactivity, and even strong wind and ocean waves.
URL: http://www.llnl.gov/str/pdfs/09_98.pdf
Indian nuclear test seismic wave pattern
![[image]](https://apunked.files.wordpress.com/2017/02/nuke-test-vs-earthquake_border2.jpg?w=640 "[image]")
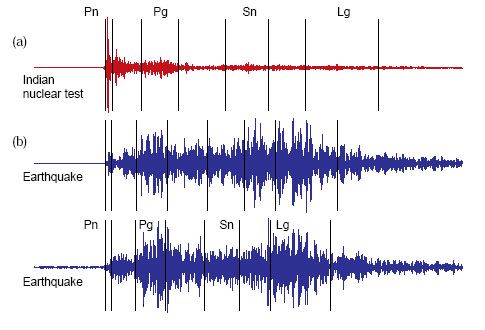
Figure 5. An international monitoring station in Pakistan detected the Indian nuclear test of
May 11, 1998, about 740 kilometers away. (a) Analysis of the seismogram showed a P-waveto-
S-wave ratio strongly indicative of an explosion and not (b) nearby earthquakes. [..]
Key algorithms provide discriminants, characteristic features of a waveform (peak-to-peak distance, height, width, or some ratio). A particularly useful discriminant, for example, is the ratio of P-wave amplitude to S-wave amplitude. The P (or primary) wave is a compressional wave that is the first to arrive at a station. The S wave or shear wave has a slower propagation speed and arrives behind the P wave. The seismogram from the Indian nuclear test of May 11, 1998, as recorded by an international monitoring system station in Pakistan about 740 kilometers away, showed a P-to-S ratio strongly characteristic of an explosion and not an earthquake (Figure 5).
http://www.llnl.gov/str/pdfs/09_98.pdf
The aircraft impacts registered local magnitude (ML) 0.9 and 0.7, indicating minimal earth shaking as a result. The subsequent collapsing of the towers, on the contrary, registered magnitudes of 2.1 and 2.3, comparable to the small earthquake that had occurred beneath the east side of Manhattan on January 17, 2001. The Lamont seismographs established the following timeline:
8:46:26 a.m. EDT [1240 UTC] Aircraft impact – north tower Magnitude 0.9
9:02:54 a.m. EDT [1302 UTC] Aircraft impact – south tower Magnitude 0.7
9:59:04 a.m. EDT [1359 UTC] Collapse – south tower Magnitude 2.1
10:28:31 a.m. EDT [1428 UTC] Collapse – north tower Magnitude 2.3
In addition, the seismic waves were short-period surface waves, traveling within the upper few kilometers [miles] of the Earth’s crust. They were caused by the interaction between the ground and the building foundations, which transmitted the energy from the impacts and collapses.
http://www.sciencedaily.com/releases/2001/11/011116064642.htm
Ground shaking
Oral reports of ground shaking before collapse
Brian Becker — Lieutenant (F.D.N.Y.) [Engine 28] We felt — our whole building that we were in, when World Trade Center 2 collapsed, that was the first one to collapse. We were in World Trade Center 1. It was a tremendous explosion and tremendous shaking of our building. We thought it was our building maybe collapsed, there was a collapse above us occurring. It was tremendous shaking and like everybody dove into this stairwell and waited for, I guess, 20, 30 seconds until it settled, and that was our experience of the other building collapsing. Interview, 10/09/01, New York Times
Michael Beehler — Firefighter (F.D.N.Y.) [Ladder 110] I was by I guess the outer part of the building and I just remember feeling the building starting to shake and this tremendous tremendous like roar and I just — I kind of didn’t even notice it, but like out of the corner of my eye, I saw out of the building, I saw a shadow coming down. At that point I thought it was the upper part of the north tower that had just basically like toppled over, fell off. I didn’t actually see the building part go by me, because I think I was on the opposite side. But I just remember feeling this tremendous tremendous shake and hearing this, like, noise. Again I can’t describe. What I did was I ended up running out. Interview, 12/17/01, New York Times
Jody Bell — E.M.T. (E.M.S.) I lost track of time. You start to hear this rumble. You hear this rumble. Everything is shaking. Now I’m like, what the hell could that be. I’m thinking we’re going to get bombed. This is an air raid. You hear this thunder, this rumbling. Then you see the building start to come down. Everybody’s like, “Run for your lives! The building is coming down!” At that moment when that building was coming down, I was strapping a patient onto a stair chair. Interview, 12/15/01, New York Times
David Blacksberg — E.M.T. (E.M.S.) I lost track of time of when the second building was coming down. It sounded like one big rumble, and then it just sounded like it just continued, and I was — I wasn’t really paying attention. I was looking at the sound. Interview, 11/23/01, New York Times
Nicholas Borrillo — Firefighter (F.D.N.Y.)on 23rd floor of North Tower:
Then we heard a rumble. We heard it and we felt the whole building shake. It was like being on a train, being in an earthquake. A train is more like it, because with the train you hear the rumbling, and it kind of like moved you around in the hall. Then it just stopped after eight or ten seconds, about the time it took for the building to come down. Interview, 01/09/02, New York Times
Peter Cachia — (E.M.S.) [Battalion 4] I was like a little too close to the tower when it started coming down, because when I started running, I knew I was too close and I really didn’t think I was going to get out of there. So about halfway up Liberty Street I saw a truck, I guess an SUV. It wasn’t a police or a fire vehicle. It was just a car that was parked there. I went under the truck while the tower came down and the ground was shaking and the truck was shaking and I thought that was it for me. I thought I was done. I stayed under there until I guess everything was over. Interview, 10/15/01, New York Times
Paul Curran — Fire Patrolman (F.D.N.Y.)North Tower:
I went back and stood right in front of Eight World Trade Center right by the customs house, and the north tower was set right next to it. Not that much time went by, and all of a sudden the ground just started shaking. It felt like a train was running under my feet.
[..] The next thing we know, we look up and the tower is collapsing. Interview, 12/18/01, New York Times
Timothy Julian — Firefighter (F.D.N.Y.) [Ladder 118] You know, and I just heard like an explosion and then cracking type of noise, and then it sounded like a freight train, rumbling and picking up speed, and I remember I looked up, and I saw it coming down.
I made it right to the corner, and there’s a column right there, and I was with my guys. We all made it to like the column, and I remember it was plate glass behind me, and I’m thinking I’m going to get hit by this glass and like a porcupine. I’m going to get it, you know, but nonetheless, it rumbled.
It was the loudest rumbling I ever heard. The ground shook, and I got thrown down, and I remember it just got black, and I got knocked down. I remember geing buried. Interview, 12/26/01, New York Times
Bradley Mann — Lieutenant (E.M.S.) Shortly before the first tower came down, I remember feeling the ground shaking. I heard a terrible noise, and then debris just started flying everywhere. People started running. Interview, 11/07/01, New York Times
Keith Murphy — (F.D.N.Y.) [Engine 47] At the time, I would have said they sounded like bombs, but it was boom boom boom and then the lights all go out. I hear someone say oh, s___, that was just for the lights out. I would say about 3, 4 seconds, all of a sudden this tremendous roar. It sounded like being in a tunnel with the train coming at you. It sounded like nothing I had ever heard in my life, but it didn’t sound good. All of a sudden I could feel the floor started to shake and sway. We were being thrown like literally off our feet, side to side, getting banged around and then a tremendous wind starting to happen. It probably lasted maybe 15 seconds, 10 to 15 seconds. It seemed like a hurricane force wind. It would blow you off your feet and smoke and debris and more things started falling. Interview, 12/05/01, New York Times
URL: http://911research.wtc7.net/wtc/evidence/oralhistories/shaking.html
The “Bathtub” and slurry wall of the World Trade Center
Genesis of the Bathtub
The WTC complex consisted of seven buildings on a 16-acre site in lower Manhattan. The deep basement (bathtub) portion of the site covers a four-city block (980 foot) by two-city block (520 foot) area some 200 feet from the east shore of the Hudson River (Figure 1). The deep basement occupies only about 70 percent of the 16-acre WTC site and is just west of the place where the Dutch landed in 1614. The size and depth of the deep basement and the alignment of the perimeter wall were dictated by several requirements: the construction of a new interstate commuter railroad (PATH) station parallel to the Greenwich Street east wall; support for an operating New York City subway tunnel located just outside the east wall; protection of the entry points of two 100-year old, 17-foot diameter PATH tunnels on the east and west; and the foundation of the twin towers (WTC 1 and WTC 2) on bedrock within the excavation (Figure 2).
The geology of the WTC site varies from east to west. On the east (Greenwich Street), 15 to 30 feet of fill cover as much as 20 feet of glacial outwash sand and silt, below which are 5 to 20 feet of glacial till/decomposed rock. The Manhattan schist bedrock is found at depths of 65 to 80 feet. A knoll of quartzite rock intrudes into the site at the southeast corner. On the west (West Street), the fill is 20 to 35 feet thick and is underlain by 10 to 30 feet of soft organic marine clay (river mud). Below the river mud is a 20-foot thick layer of glacial outwash sand and silt and 5 to 20 feet of glacial till/decomposed rock. Bedrock is found at depths of 55 to 75 feet. Groundwater levels were within several feet of ground surface. [..]
The basement was bounded by a 3,500-foot long, 3-foot thick slurry wall (perimeter wall) constructed from grade and socketed into rock located at depths of as much as 80 feet.
[The slurry walls contained bentonite at first which was replaced with concrete.]
URL: http://www.members.nae.edu/nae/bridgecom.nsf/weblinks/CGOZ-58NLJ9?OpenDocument

Description: Img: http://www.deepexcavation.com/uploads/case_studies/WTC_TimesPhoto_Edited_1small.JPG URL: http://www.deepexcavation.com/en/4-world-trade-center World Trade Center Bathtub and Original Conditions (adapted from NY Times 9/18/01)
Caption: DIAPHRAGM WALL CASE STUDY #4: World Trade Center Recovery, NY, NY
The tragic events of 9/11/01 have left few people untouched. One of the greatest “heroes” of the day has been the “bathtub” of the World Trade Center, being able to resist the tremendous forces generated by the destruction while holding back the Hudson river from entering the New York City tunnel system. The “bathtub”, is actually a 3 ft thick (0.91 m) structural slurry wall that keeps water and soil out of the excavation.
http://www.deepexcavation.com/en/4-world-trade-center

Img: http://911research.wtc7.net/wtc/arch/docs/bathtub_plan2.jpg URL: http://911research.wtc7.net/wtc/arch/foundation.html
Caption: The bathtub contained the footprints of the Twin Towers and Buildings 3 and 6.
![[image]](https://apunked.files.wordpress.com/2017/02/bathtub_wall_section_s_border.jpg?w=640 "[image]")
Img: http://911research.wtc7.net/wtc/arch/docs/bathtub_wall_section_s.jpg URL: http://911research.wtc7.net/wtc/arch/foundation.html
Caption: This illustration shows a cross-section of the bathtub tall. The diagonal lines represent the post-tensioned tie-backs: cables that resist pressure pushing inward on the bathtub.

Img: http://911research.wtc7.net/wtc/arch/docs/bathtub_wall1_s.jpg URL: http://911research.wtc7.net/wtc/arch/foundation.html
Caption: This photograph shows the bathtub wall after most of the rubble from the 9/11/01 attack was removed. Portions of basement floors are visible in the right-hand side of the photograph.
Bathtub covered 9 blocks
About half of the superblock that the World Trade Center occupied contained a deep basement, the so-called bathtub. It was a skewed rectangle with sides about 980 and 520 feet, and a depth of about seven stories.
The bathtub is the 9-block area of the World Trade Center site that is excavated down to bedrock and hard soils and ringed by the slurry wall. The bathtub was created to enable the building of the Twin Towers’ foundations, and was ultimately filled with seven stories of basements housing the parking garage, mall, and building services. Since the ground water level at the World Trade Center site was just a few feet below the surface, while bedrock was about 70 feet below the surface, creating the bathtub required first building a 7-story dam below the water level of the adjacent Hudson River — the slurry wall. [..]
Four of the World Trade Center buildings — the Towers and Buildings 3 and 6 — rested on foundations entirely within the bathtub.
http://911research.wtc7.net/wtc/arch/foundation.html
Building the slurry wall
The question was how to keep the Hudson out.
Jack Kyle, chief engineer at the Port Authority, came up with an answer. It was known as the slurry trench method. Excavating machines with clamshell buckets dug a three-foot-wide trench right down to bedrock 70 feet below. They did it in 22-foot-wide sections all the way around the site. As they removed fill from each section, they pumped in a slurry of water and bentonite, an expansive clay. The clay naturally plugged any holes in the sides of the dirt walls.
When they had fully excavated a section of the trench, workers slid a 25-ton, seven-story-high cage of reinforced steel into the section, then filled that portion of the trench with concrete from the bottom up. The yard-thick wall became known as the “bathtub,” though this bathtub was meant to keep water out, not in.
URL: http://www.pbs.org/wgbh/nova/wtc/innovation.html

Img: http://www.pbs.org/wgbh/nova/wtc/images/inno-allthree.gif URL: http://www.pbs.org/wgbh/nova/wtc/innovation.html
Caption: (1) Builders of the “bathtub” wall first excavated a three-foot-thick trench segment that was 65 feet deep by 22 feet wide and filled it with a stabilizing slurry. (2) They then lowered a giant steel cage into the trench, with attachment points for reinforcing tiebacks that were later anchored to bedrock outside the wall. (3) Finally, they poured in concrete, which, as it rose from the bottom up, forced out the temporary slurry.
URL: http://www.pbs.org/wgbh/nova/wtc/innovation.html
The World Trade Center was built on bedrock

IMG: http://www.reformation.org/wtc-bedrock.jpg URL: http://www.reformation.org/ground-zero.html
Caption: The soil on the island of Manhattan is perfect for building skyscrapers. In midtown Manhattan, BEDROCK is only about 10 feet or 3 meters deep. However, at the location of the Twin Towers in the lower part of Manhattan BEDROCK is about 100 ft or 30 meters deep. There is also the problem of water from New York harbor and the Hudson River. Midtown Manhattan was thus the IDEAL place to build the Twin Towers.
When it comes to demolition by nuclear weapons the deeper the foundation the better because depth of soil hides the effects of RADIATION: “By testing underground, man has placed a shield around most radioactive by-products from nuclear explosions. In contained underground detonations of fusion devices, radioactive products are trapped in cracked rock and rubble beneath the ground’s surface. The gaseous products such as water vapor, carbon dioxide, iodine, and tritium gradually cool. Most of the water and iodine condenses to a liquid. Neutrons promptly interact with lithium in the rock minerals to produce the radioactive isotope tritium (see Box 2.1), and this heavy isotope, in part, replaced ordinary hydrogen in water to form tritiated water. The radioactive water mixes with natural ground water and moves with it through the surface rock.”(Bolt, Nuclear Explosives and Earthquakes, pp. 83-84).
